
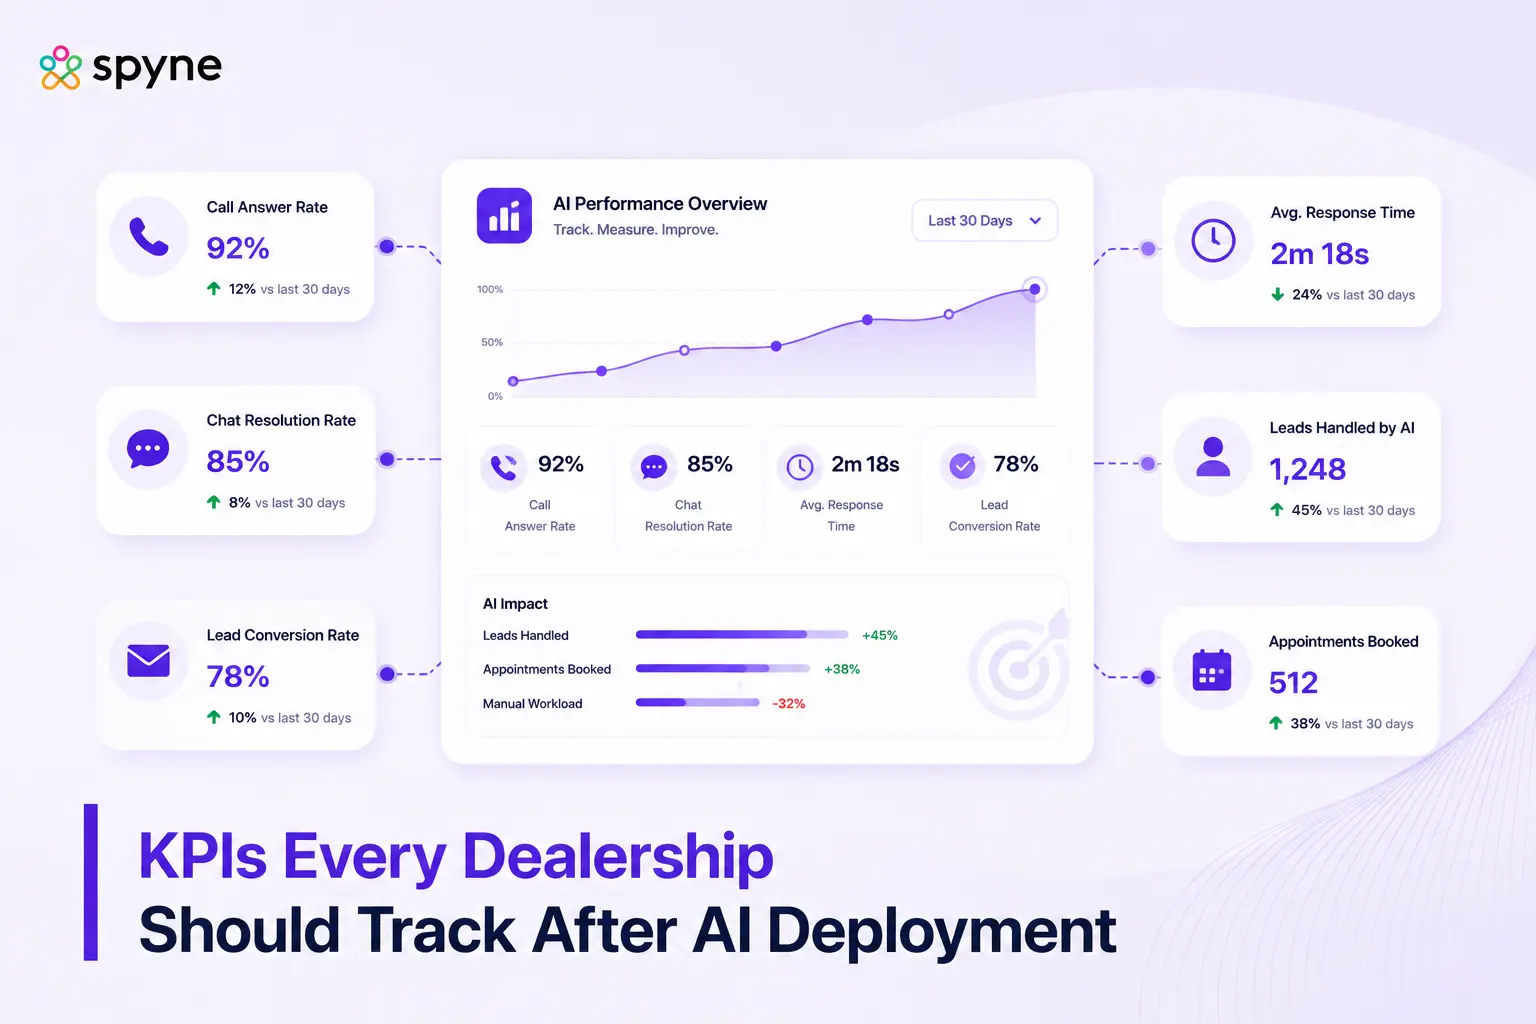

| Executive Summary: Track four KPIs in the first 30 days: call answer rate, CRM record completion rate, appointment show rate on AI-booked appointments, and escalation resolution rate. Past the pilot, add CSI impact, no-show rate reduction, cost per recovered lead, and handoff success rate. Appointment volume is the wrong headline metric because more bookings can still produce weak shows, incomplete CRM records, or poor handoffs. The deployment is working only when coverage, data quality, customer outcomes, and recovered revenue improve together. |
Dealerships often deploy AI and immediately watch the easiest dashboard numbers: calls handled, conversations completed, and appointments booked. Those figures confirm activity, but they do not confirm business impact. An AI agent can answer more calls while creating incomplete CRM records. It can set more appointments while lowering the show rate. It can transfer more customers while sending them to the wrong team without context.
A useful dealership AI scorecard follows the customer from the first ring to a completed sales or service outcome. The first 30 days should prove operational reliability. The next 60–90 days should prove customer and financial impact. That sequence lets a dealer principal distinguish a platform that looks busy from one that recovers real opportunities.
Why Appointment Volume Is the Wrong Headline Metric
Appointments set are an intermediate event, not a dealership outcome. A booked appointment creates value only when the customer is qualified, the slot is valid, the CRM record is usable, reminders are delivered, the customer arrives, and the store completes the next step. A platform can increase the top-line booking count while weakening several of those links.
The same principle applies to calls handled. Answering the phone is valuable, but an answered call that ends with an incorrect answer, an unusable record, or an abandoned escalation has not been recovered. The headline should therefore be the percentage of eligible opportunities that progress to a verified business outcome: shown, resolved, opened as a repair order, or sold.
Automotive research illustrates the distinction. In Pied Piper’s 2025 Service Telephone Effectiveness study, AI successfully handled service calls without human help 91% of the time, while customers successfully scheduled an appointment 86% of the time at AI-reliant dealerships versus 90% at human-reliant dealerships. The figures measure different stages of the journey; neither should be substituted for the other.
Practical example: if an AI books 120 sales appointments and 78 customers arrive, its show rate is 65%. A human-booked cohort with 100 appointments and 80 arrivals produces fewer bookings but an 80% show rate. The AI created more calendar activity, while the human cohort produced more showroom traffic. The dealer should investigate qualification, confirmation, and reminder quality before scaling the AI workflow.
What KPIs Should You Track in the First 30 Days?
The first month is a controlled pilot, even when the AI launches across an entire rooftop. Compare the same departments, lead sources, hours, and appointment types against the 30 days before go-live. Do not combine sales and service into one storewide average; the call mix and desired outcome are different.
Before comparing results, publish a one-page measurement specification. For every KPI, document the business question, numerator, denominator, exclusions, source system, reporting owner, refresh cadence, and threshold that triggers action. This prevents the vendor dashboard, CRM report, and DMS report from using the same label for different populations.
For vendor selection criteria, see Spyne’s dealership AI buyer’s guide.
How Do You Set Up Accurate KPI Measurement Before Reviewing the Dashboard?
A KPI is only as trustworthy as the system that produced it. Before reviewing any dashboard against a target, agree on where each number comes from, or two departments will report different appointment counts for the same day.
- Freeze the baseline window. Use the 30 days before launch, matched by day of week, department, lead source, and appointment type.
- Assign one source of truth per data type. Telephony owns call attempts. The CRM owns lead status and appointments. The DMS owns arrivals and sold outcomes.
- Define exclusions once, in writing. Spam, duplicates, test calls, and abandoned calls need one shared rule, not five department-specific ones.
- Keep cohort tags immutable. AI-booked, human-booked, and hybrid attribution should survive any handoff to a rep.
- Audit samples manually, weekly. Check successful, failed, and escalated conversations against what the dashboard reports.
Vini AI’s own logs confirm a call connected or an appointment was requested. Reconcile that against the CRM and DMS to confirm the customer arrived, an RO opened, or a vehicle sold, so an activity event never gets mistaken for a completed outcome.
1. Call Answer Rate
Formula: Eligible inbound calls answered by AI or staff ÷ total eligible inbound calls × 100
This shows whether the deployment fixed the coverage problem it was purchased to solve. Define “eligible” before launch and exclude spam, blocked numbers, abandoned calls below the agreed threshold, and any call types outside the AI workflow. Report overall coverage, after-hours coverage, peak-hour coverage, and department-level coverage separately.
A near-complete rate is the goal, but the change from the store’s own baseline matters most. A store moving from 65% to 92% has created meaningful coverage even before it reaches the final target.
Pair answer rate with first-response latency and repeat-call rate as diagnostics. A high answer rate with long silence, frequent disconnects, or customers calling back within 15 minutes can indicate that the system technically answered but did not complete the job. Break the rate out by business hours, after-hours, weekends, campaign traffic, and department so peak-period failures are visible.
2. CRM Record Completion Rate
Formula: AI-handled interactions with every required field logged ÷ total AI-handled interactions × 100
A call is not fully handled if the CRM record is missing the buyer’s vehicle, contact details, intent, timeline, appointment outcome, disposition, or next action. For service, required fields may include customer and vehicle identification, service concern, appointment slot, transportation need, and escalation status.
A useful weekly audit scores both completeness and accuracy. Completeness asks whether each required field exists. Accuracy asks whether the value matches the conversation. A record can be 100% complete and still be wrong if the AI attaches the wrong stock number, appointment time, customer, or disposition. Track duplicate-record rate and writeback latency as supporting diagnostics.
Vini AI is designed to log the conversation outcome, appointment, lead status, and next action into a connected dealership system. Dealers should validate that promise field by field during the pilot. Create separate exception queues for failed writebacks, unmatched customers, duplicate records, invalid appointment slots, and records that arrived after the store’s response SLA.
3. Appointment Show Rate on AI-Booked Appointments
Formula: AI-booked appointments that arrive ÷ total AI-booked appointments × 100
Appointment volume is easy to inflate. Show rate reveals whether the AI booked the right customer, set a realistic time, confirmed the details, and ran an effective reminder sequence. Track AI-booked appointments as their own cohort and compare them with human-booked appointments from the same department and lead source.
For a deeper qualification framework, see AI lead qualification for dealerships.
If bookings rise while shows fall, the problem is usually qualification, expectation-setting, reminder timing, or appointment data, not a lack of activity.
Use the original appointment as the denominator and define how reschedules are credited. A customer moved from Tuesday to Thursday should not appear as both a Tuesday no-show and a new Thursday appointment. For sales, follow the cohort from show to write-up, demo, appraisal, and sale. For service, follow arrival to opened and completed repair order.
4. Escalation Resolution Rate
Formula: Escalations resolved within the agreed SLA ÷ total AI escalations × 100
Count an escalation as successful only when it reaches the correct person, carries the conversation context, and is resolved within the store’s service-level agreement. A transfer that lands in another voicemail box is not a resolution. Review failed escalations by reason: incorrect routing, no staff available, missing context, system error, or unresolved customer objection.
Vini AI supports warm transfers and callback scheduling when a human is needed. The practical test is whether the salesperson, advisor, parts representative, or manager received a usable summary and accepted ownership. Log offered, connected, accepted, and resolved as separate timestamps; a transfer attempt should never be counted as a successful handoff.
This is a major risk point. Pied Piper’s 2026 Internet Lead Effectiveness study found that inquiries requiring human help scored nine points lower on average and were twice as likely to receive no personal response. The lesson for dealers is straightforward: automation performance and human follow-through must be measured as one workflow.
How Should Dealerships Measure Vini AI?
Vini AI should be evaluated as an operating layer across the dealership, not as a standalone call bot. Its sales and service agents can work across voice, SMS, and web chat; handle inbound coverage; support outbound follow-up; book appointments; update connected systems; and route customers to people. The scorecard should pair each Vini event with the dealership-owned outcome that proves value.
| Vini workflow | Event to capture | Decision KPI | Validation source |
| Inbound sales or service coverage | Connected conversation, channel, department, daypart, disposition | Eligible calls answered; qualified-contact rate | Telephony records plus Vini conversation logs |
| Appointment booking | Requested slot, confirmation, reschedule or cancellation | AI-booked show rate; no-show reduction | CRM or service scheduler, verified against DMS/RO data |
| CRM or scheduler writeback | Customer, vehicle, intent, notes, status and next action | Record completion and accuracy; writeback latency | Dealership CRM, scheduler and exception log |
| Warm transfer or callback | Transfer offered, destination, summary and callback task | Handoff success; escalation resolution | Vini event log plus employee acceptance and resolution |
| Aged-lead or no-show follow-up | Contact attempt, response, requalification and rebooking | Cost per recovered lead; recovered-show rate | CRM cohort history and matched pre-deployment baseline |
| Recall or due-service outreach | Eligible customer, connection, consent/opt-out and booking | Connect-to-book rate; appointment-to-RO rate; recovered gross | Campaign log, scheduler and completed repair orders |
What Vini AI Can Measure, and What the Dealership Must Verify
The Vini layer can document conversation activity: when the interaction started, which channel and workflow handled it, what the customer asked, whether an appointment or callback was created, and whether a transfer was attempted. Those records are essential for diagnosis and auditability. They do not independently prove a show, sale, completed repair order, gross contribution, or CSI improvement.
Make the dealership system the final authority for downstream outcomes. Join records with a stable lead, customer, appointment, or VIN identifier; retain the original AI-assisted tag; and define an attribution window before launch. If the join fails, place the record in an exception queue instead of silently excluding it. That discipline makes the dashboard useful to the BDC manager, fixed-ops director, controller, and dealer principal.
How to Read Vini AI Case Results Responsibly
Spyne’s supplied dealer case studies show what well-matched Vini workflows have produced, but they are not universal targets. Each result reflects a specific store, call mix, integration, workflow, and measurement window. Use the figures to select hypotheses for a pilot, then calculate the dealership’s own baseline and target.
| Dealer | Vini deployment | Spyne-reported result | How another dealer should validate it |
| Feldmann Imports | Service inbound with real-time scheduling | +35% demand capture; +25% RO lift; 50+ additional monthly appointments | Measure after-hours answer rate, qualified-to-booking rate, show rate and completed ROs. |
| McGrath Acura of Westmont | Sales and service inbound, including after-hours | +25% demand capture; 15% of bookings after hours; 50+ additional monthly appointments | Separate after-hours incremental bookings from total bookings, then verify shows. |
| Bob King Mazda | Service inbound and overflow coverage | +30% demand capture; +12% service-appointment lift; 100% after-hours coverage | Confirm that captured demand converts into arrivals and opened repair orders. |
| Paragon Honda | Sales inbound plus recall outreach | $314,524 in reported AI-assisted closures over 30 days; 48% appointment-to-sale rate; 33% recall booking rate | Audit the AI-assisted revenue rule and track recall bookings through completed ROs. |
How Should Dealership AI KPIs Be Segmented?
A single rooftop average is rarely diagnostic. It can hide strong after-hours coverage behind weak daytime routing, or mix high-intent inbound calls with low-connect outbound campaigns. Every KPI should be filterable across the dimensions that materially change customer intent and store execution.
| Dimension | Recommended cuts | Why it matters |
| Department | Sales, service, BDC, parts, and finance | Each department has a different completion event and escalation path. |
| Channel and direction | Inbound phone, outbound phone, SMS, email, and web chat | Answer, connect, response, and opt-out behaviors are not interchangeable. |
| Lead source | Website, OEM, marketplace, paid media, organic, database, and referral | Lead intent and historical conversion vary by source. |
| Daypart | Business hours, lunch, evenings, weekends, and holidays | AI often creates the largest lift where staffing coverage is weakest. |
| Workflow | New lead, missed-call recovery, nurture, recall, no-show, and status request | Each workflow needs its own denominator, SLA, and value definition. |
| Ownership model | AI-only, human-only, and AI-assisted | Hybrid records reveal whether the handoff adds value or introduces delay. |
Example: reporting an 82% overall AI-booked show rate may look healthy. If sales is at 86%, service is at 84%, and an outbound reactivation campaign is at 58%, the store does not have a platform-wide problem. It has a specific campaign, qualification, or reminder problem. Segmentation tells the team where to act without shutting down workflows that are performing.
What KPIs Matter Long-Term, Past the Pilot Phase?
Once the workflow is stable, the scorecard must move from system activity to customer behavior and recovered economics. Review these metrics monthly and by department, lead source, workflow, and rooftop.
-
CSI Impact
Compare the rolling CSI trend before and after deployment for the workflows the AI actually touches. Look at communication-related comments, scheduling friction, status-update complaints, and escalation feedback. Do not attribute every CSI movement to AI; inventory availability, advisor performance, wait times, and repair quality still influence the score.
Customer experience matters well after the original interaction. Cox Automotive’s 2025 Fixed Ops and Ownership research reports that 88% of consumers say the service experience affects their likelihood of buying from that dealer again. Among customers who returned to a dealership for service, 74% said they were likely to repurchase there, compared with 44% among those who did not return. AI-related communication should therefore be evaluated as part of retention, not as an isolated call-center metric.
-
No-Show Rate Reduction
Formula: (Pre-deployment no-show rate − current no-show rate) ÷ pre-deployment no-show rate × 100
Track no-show reduction by appointment source and department. A storewide average can hide a weak AI-booked cohort behind stronger human-booked appointments. Also measure the percentage of no-shows that are successfully rescheduled and later arrive.
Report both absolute and relative improvement. Moving from a 20% no-show rate to 16% is a four-point absolute reduction and a 20% relative reduction. State which one the dashboard uses. Also separate customer cancellations, dealer cancellations, reschedules, and true no-shows; each requires a different operational response.
-
Cost per Recovered Lead
Formula: AI platform and allocated workflow cost ÷ recovered leads attributable to AI
A recovered lead is an opportunity that would probably have been lost without the AI: an answered after-hours call, a missed-call recovery, a reactivated dormant lead, or a no-show that was rebooked. Apply a written attribution rule before calculating the metric. Otherwise, every AI-touched lead may be counted as recovered even when a human team already had it in progress.
Use a conservative recovery rule. Require evidence of an incremental event, for example, the lead had no staff response inside the SLA, the call occurred outside staffed hours, the lead was dormant for the defined period, or the original appointment was marked as a no-show before the AI rebooked it. Exclude leads that were already active in a salesperson’s or advisor’s task queue.
-
Handoff Success Rate
Formula: Context-complete handoffs accepted by the correct person ÷ total AI handoffs × 100
A successful handoff gives the rep or advisor the customer’s identity, intent, relevant vehicle or service context, objections, and agreed next step before the conversation continues. Pair this KPI with rep override rate: repeated re-qualification signals low trust in the AI summary or poor CRM placement.
Measure three handoff events separately: offered, accepted, and resolved. Offered proves the AI recognized its boundary. Accepted proves the right employee took ownership. Resolved proves the customer received the answer or next step. Reporting only the first event rewards transfers instead of customer outcomes.
How Do You Calculate Dealership AI ROI Without Overstating It?
ROI formula: (Incremental gross attributable to AI − total AI cost) ÷ total AI cost × 100
The difficult term is incremental. AI-touched revenue is not the same as AI-created revenue. A customer may speak with the AI and still have converted through the existing BDC process. To make the calculation defensible, trace value through a documented attribution waterfall.
- Start with eligible opportunities. Count only calls, leads, no-shows, or dormant records inside the deployed workflow.
- Estimate the counterfactual. Use the matched pre-launch answer, contact, show, and close rates to estimate what would have happened without AI.
- Count the incremental lift. The difference between the observed result and the matched baseline is the recoverable cohort.
- Attach realized value. For sales, use actual front-and-back gross from sold units. For service, use gross from completed repair orders, not the value of work merely recommended.
- Subtract full cost. Include platform fees, telephony or message usage, integration expense, implementation labor, ongoing QA, and any incremental media or staffing cost.
Illustrative sales example, not an industry benchmark: a store receives 1,000 eligible sales calls. Answer coverage improves from 81% to 98%, creating 170 additional answered calls. If 30% are qualified, 60% of those book, 80% show, and 20% of shows buy, the lift produces about five incremental sales. At $2,500 actual gross per sale, incremental gross is about $12,500. If the allocated AI cost is $5,000, the illustrative ROI is 150%. Replace every assumption with the store’s observed rate and actual gross.
Group operators can compare enterprise requirements in Spyne’s guide to the best AI platforms for dealership groups.
How Do These KPIs Differ by Department: Sales vs. Service?
The formulas remain consistent, but the business outcome changes. Sales AI should move qualified buyers toward a shown appointment and a sold unit. Service AI should move customers toward a completed appointment, repair order, and stronger retention.
| KPI area | Sales | Service |
| Primary outcome | Shown appointment that progresses to write-up, demo, appraisal, or sold unit | Customer arrives, repair order is opened, and requested work is completed |
| Coverage | Internet leads, VDP calls, trade-in inquiries, after-hours and overflow | Scheduling, status, recall, maintenance, parts, after-hours and overflow |
| CRM completion | Vehicle, timeline, trade, budget/finance, source, owner, next action | Customer, VIN/vehicle, concern, appointment, transportation, escalation |
| Show quality | Test-drive or showroom show rate, then appointment-to-sale rate | Service arrival rate, then appointment-to-RO and completed-RO rate |
| Handoff success | Correct BDC or salesperson accepts a qualified lead with context | Correct advisor, scheduler, parts rep, or manager resolves the request |
| Long-term value | Close rate, gross per AI-sourced sale, cost per recovered sales lead | CSI, no-show reduction, recovered RO revenue, retention and bay utilization |
What Is a Realistic KPI Baseline vs. Target?
Use the last 30 days as the store baseline and the live industry figures below as reference points, not guarantees. Match the comparison window for lead source, department, business hours, and call type. Label recommended operating targets separately from published benchmarks so the dashboard does not imply false precision.
| KPI | Baseline / reference | Practical target / decision rule |
| Call connect / answer rate | Industry reference: about 65% connect rate. One live deployment example moved from about 81% to near-complete coverage. | Reach 95–100% of eligible inbound calls, reported by department and daypart. |
| CRM record completion | Audit the 30 days before launch for complete required fields, not generic notes. | 95%+ complete records; investigate missing-field patterns weekly. |
| AI-booked show rate | Industry scheduling reference: 75–85%; Xtime reports an 86% average show rate for Kia Schedule. Compare equivalent human-booked cohorts. | At least 75% and at or above the store’s matched human-booked rate. |
| Escalation resolution | Establish a two-week baseline by reason, department, and time of day. Published research shows human-help steps are a material failure point. | 90%+ within the agreed SLA, with every unresolved escalation traceable. |
| No-show rate | A 75–85% show rate implies a 15–25% no-show range before rescheduling. | Reduce the store’s matched baseline by 10–20% over 60–90 days. |
BASELINE TABLE CONTINUED
| KPI | Baseline / reference | Practical target / decision rule |
| Handoff success | Audit accepted, context-complete handoffs during the pilot. | 90%+ accepted by the right person with all required context. |
| CSI impact | Use the pre-deployment 90-day rolling average and communication comments. | No decline during stabilization; then an improving communication trend. |
| Cost per recovered lead | Compare with manual recovery cost and paid cost per qualified lead. | Keep cost well below expected gross contribution from the recovered cohort. |
What Should a 30/60/90-Day KPI Review Look Like?
The review cadence should change as the deployment matures. Early reviews focus on instrumentation and workflow failures. Later reviews focus on outcomes and economics. Keep a weekly operating review for exceptions, plus a monthly leadership scorecard for trend and ROI.
Pair this scorecard with an AI implementation roadmap for dealerships.
| Phase | Primary question | Measures | Management decision |
| Days 0–30 | Can the workflow operate reliably? | Answer rate, CRM completion, AI-booked show rate, escalation resolution | Fix routing, data mapping, qualification, prompts, reminders, and staffing coverage. |
| Days 31–60 | Does quality hold as volume grows? | The four pilot KPIs by cohort, plus no-show reduction and handoff success | Expand only the workflows that meet quality thresholds; retrain or narrow weak ones. |
| Days 61–90 | Is the deployment creating measurable value? | CSI trend, recovered leads, realized gross, cost per recovery, and ROI | Approve scale, renegotiate scope, or pause the workflow based on incremental value. |
| Ongoing | Is performance stable over time? | Trend, drift, complaint themes, override rate, source mix, and rooftop variance | Investigate material changes before averages normalize or hide the decline. |
This continuous review model is consistent with the NIST AI Risk Management Framework, which recommends regular monitoring to identify performance degradation, unusual behavior, near misses, and operational impact after deployment. For a dealership, monitoring should include both system metrics and customer-facing outcomes.

Closing Thoughts
The right dashboard should answer four questions: Did more customers reach the store? Did the CRM receive usable records? Did qualified appointments show? Did recovered opportunities create gross and customer value?
If the platform cannot connect coverage to CRM quality, shows, handoffs, CSI, and revenue, the dealer is managing activity. Vini AI supports the workflows and reporting needed to evaluate those outcomes after deployment. Bring your last 30 days of call, appointment, and CRM data, and map the baseline before the first workflow goes live. See what your first 30-day scorecard could look like. Book a Vini AI demo.