
Executive SummaryAn automotive CRM with reporting dashboard capability turns scattered lead, sales, and follow-up data into one live view a manager can act on the same day. Cox Automotive’s 2024 Power of Data study found four in five dealers believe their data can improve forecasting and profitability, yet only 26% trust the insights third-party tools provide. The strongest platforms close that gap with real-time dashboards, role-based views, and rep-level tracking built directly into the CRM, not bolted on afterward. |
A sales manager pulls up Monday’s numbers and gets three different totals: one from the CRM, one from a BDC spreadsheet, and one a rep remembers differently. Cox Automotive’s Digitization of Automotive Retail Study found 62% of dealers now juggle multiple retailing tools, and reconciling them eats hours that should go toward selling cars. An automotive CRM with reporting dashboard capability removes that guesswork by putting lead activity, pipeline health, and rep performance on one live screen. Here is what that reporting should include, a few automotive CRM reporting tips worth adopting, and where dealers get it wrong.
What Is an Automotive CRM With a Reporting Dashboard?
An automotive CRM with a reporting dashboard is customer relationship management software that pairs standard lead and pipeline management with a live, visual view of dealership performance data. Instead of exporting activity into a spreadsheet or waiting on a weekly PDF, managers open the CRM and see lead volume, response times, and deal status updating as they happen. Automotive-specific CRMs differ from generic business CRMs here because the dashboard is built around a vehicle sale’s actual shape: a lead moves through defined stages such as New, Contacted, Qualified, Test Drive, Negotiation, and Won or Lost, and the reporting layer needs to reflect that exact pipeline rather than a generic sales funnel.
This differs from a standalone CRM report, a static document built to review trends after the fact, and from a bolt-on analytics tool that reads CRM data from outside the platform. A true reporting dashboard lives inside the CRM itself, tied to the same lead and customer records the sales team already uses. For dealers comparing platforms, the real question is not whether a CRM claims to offer reporting, since nearly all of them do, but whether that reporting updates live, breaks down by rep and source, and is simple enough that a GM actually opens it every day.
Why Real-Time CRM Reporting Matters for Dealership Performance
Reporting only helps if someone acts on it before the numbers go stale. Cox Automotive’s 2024 Power of Data study found that four in five dealers agree their data can improve forecasting, demand generation, and profitability, but only 26% say they are confident in the insights third-party vendors provide.
That gap comes down to timing and trust. A Friday report describing last week’s leads cannot change how Tuesday’s leads get worked. A live automotive CRM with reporting dashboard closes that gap by surfacing lead response time, pipeline stalls, and rep activity as they happen, so a sales manager can redirect a slow lead or coach a rep the same day instead of the same month.
What Reporting Features Should an Automotive CRM Have?
Dealers evaluating an automotive CRM with reporting dashboard capability should look for a specific set of KPIs and layout, not a generic analytics claim. At minimum, the dashboard should track:
| KPI | What It Shows |
| Total Leads | Leads received across all sources |
| New Leads Today | Current lead inflow |
| Conversion Rate | Leads converted to sales |
| Test Drives | Scheduled and completed test drives |
| Bookings and Deliveries | Vehicles booked versus delivered |
| Revenue | Total sales value |
| Lead Response Time | Speed of first follow-up |
| Salesperson Performance | Leads, conversions, and revenue by rep |
| Source Performance | Leads by website, Google, Meta, referral, and other channels |
| Lost Leads | Lost opportunities and the reasons behind them |
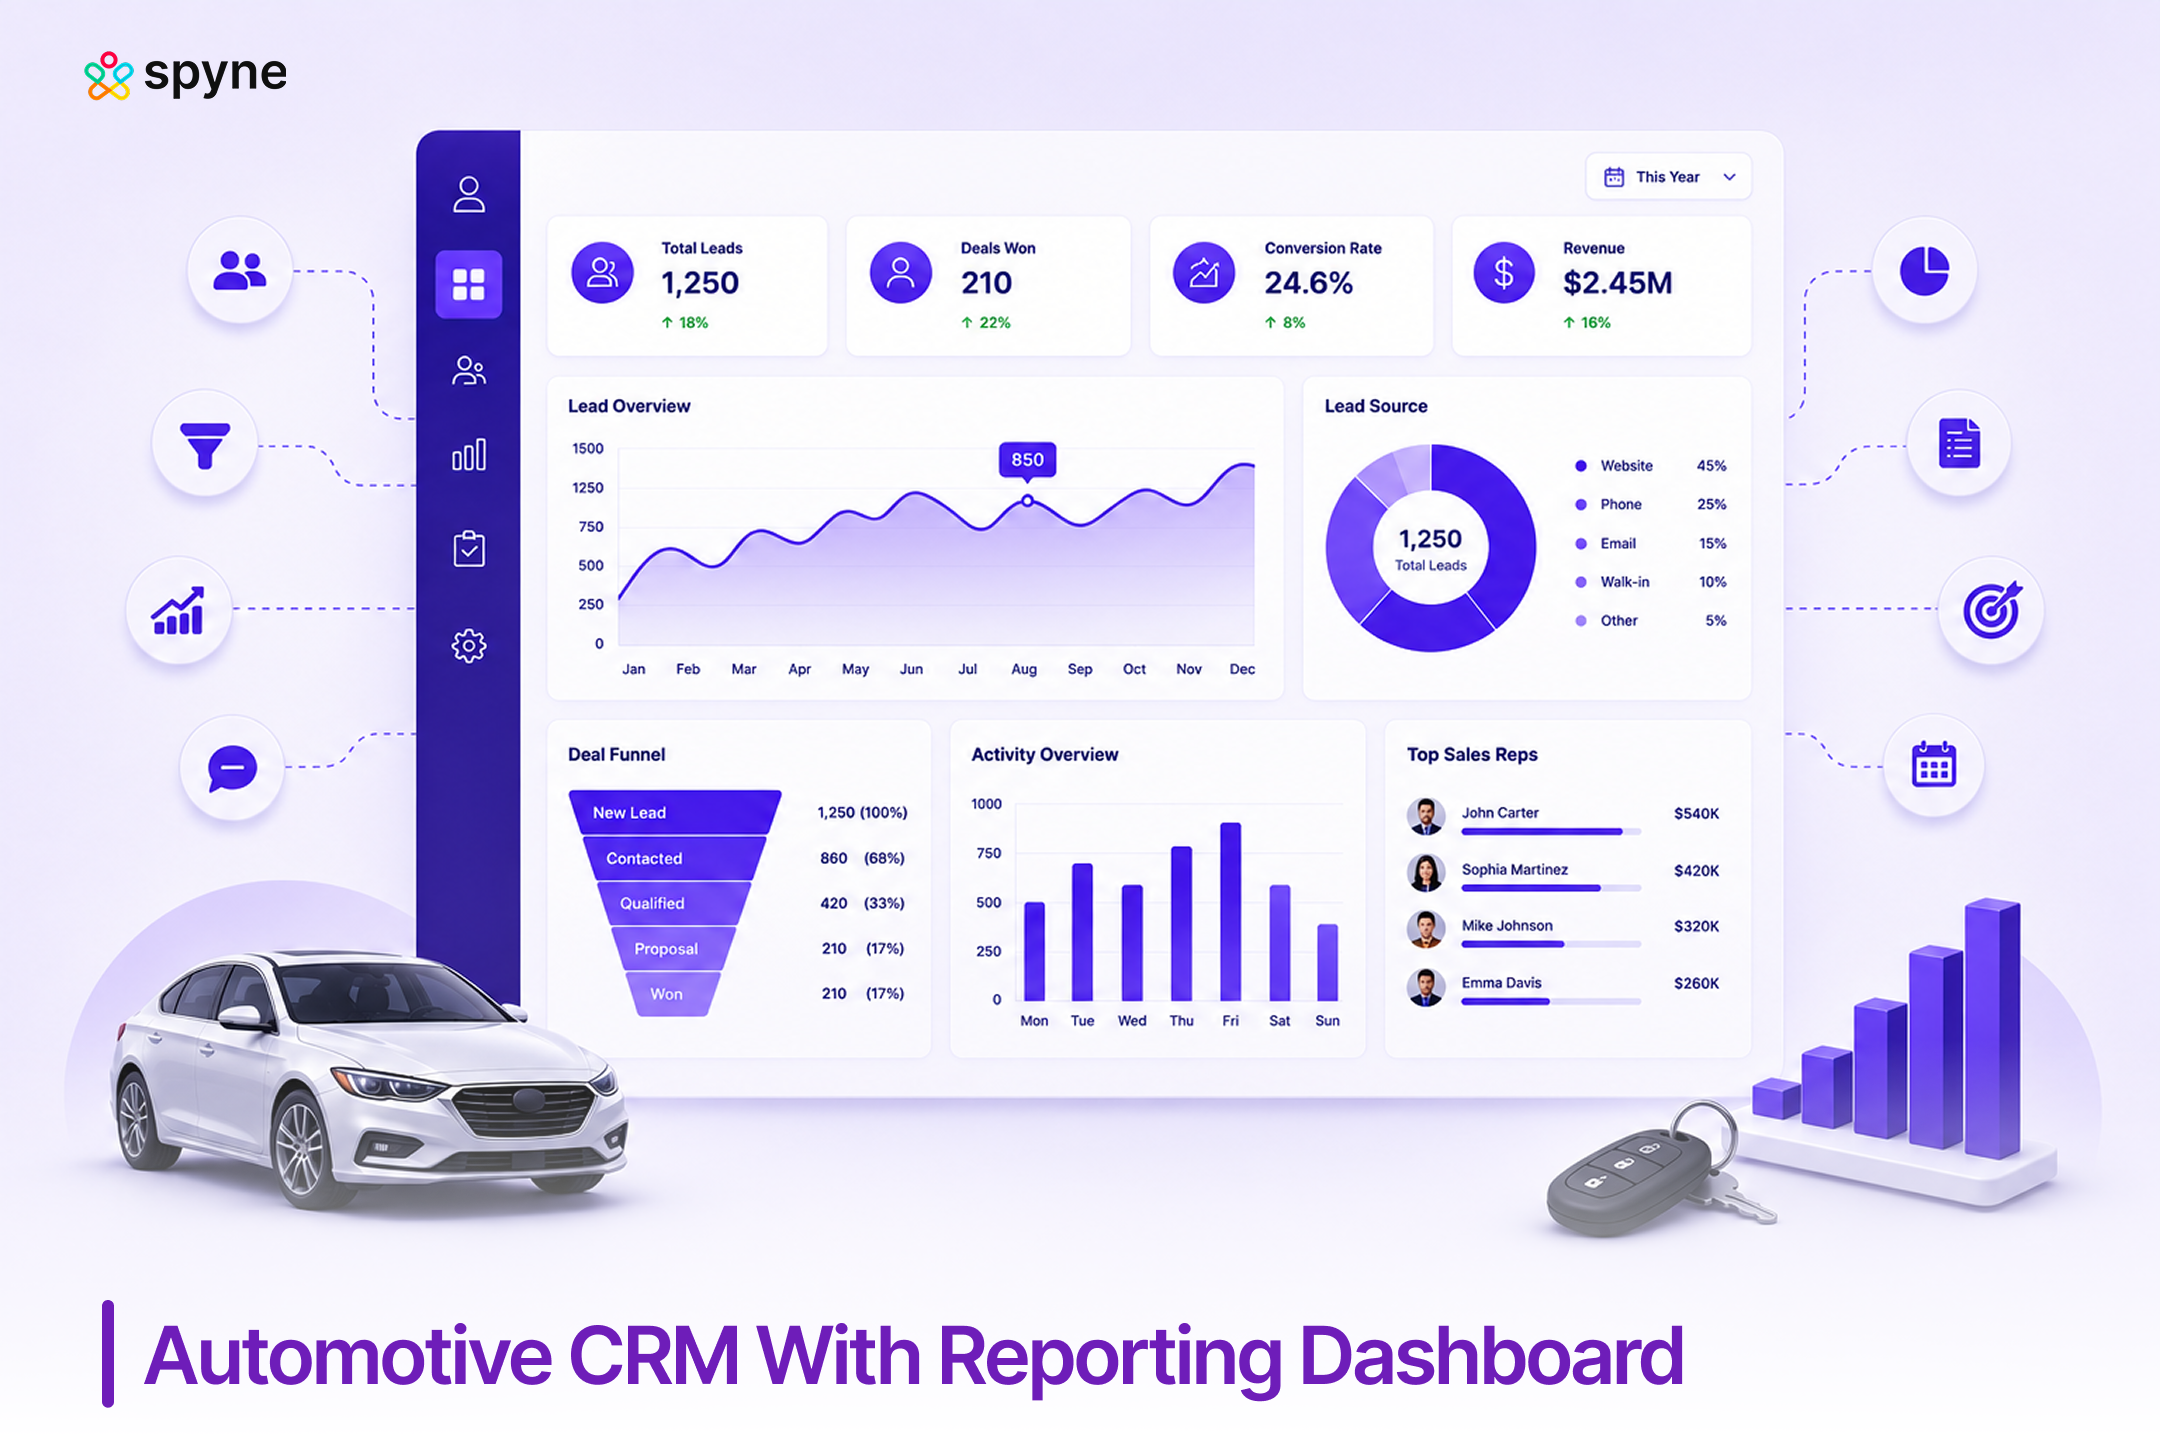
A well-built dashboard also organizes this into a layout a manager can scan in seconds: a top row of headline numbers (leads, test drives, bookings, deliveries, revenue, conversion rate), a middle section with a sales funnel chart, leads by source, and sales by salesperson, and a bottom section covering pending follow-ups, hot leads, lost-lead reasons, and a salesperson leaderboard. A platform that checks most of these boxes gives a dealership genuine dealer CRM analytics and reporting, not just a dashboard that looks good in a demo.
What to Evaluate When Comparing Automotive CRM Reporting Dashboards
Vendor demos tend to show the same three or four polished charts. Before signing anything, ask to see these live, using real dealership data, not a canned example:
- Lead source to appointment to show to sold conversion, by channel
- Salesperson activity and response time, by individual rep
- BDC performance and aging or unsold lead reports
- Lost-sales analysis, including reasons leads did not convert
- Follow-up compliance across the sales team
- Cross-rooftop or multi-location dashboards, if the dealership runs more than one store
- Role-based views, so a GM, sales manager, and BDC lead each see a screen built for their job
- DMS integration speed, since a dashboard that only refreshes on a nightly batch is not really real-time
Some enterprise platforms also offer equity mining, automated alerts that flag customers with positive trade-in equity based on payment history and service records, and deeper finance and insurance reporting such as gross profit per deal. These matter more for larger, multi-rooftop groups than for a single independent store, and dealers should confirm whether a platform includes them natively or requires a separate add-on before assuming the feature is included.
Ask vendors to show live BDC lead-response tracking and DMS sync speed side by side, since two platforms that look equally polished in a demo can differ by hours in how fast their dashboard numbers actually update once a lead hits the system.

Best Automotive CRM With Reporting Features
The best automotive CRM with reporting features depends on what a dealership already runs, how large its team is, and whether it operates one rooftop or several. The table below reflects the platforms that come up most often in dealer comparisons for this exact question.
| Platform | Best For | Reporting and Dashboard Highlights |
| Spyne Automotive CRM | Dealers who want real-time reporting paired with AI-driven lead engagement | Live lead and sales dashboard, role-based views, BDC and rep performance tracking, cross-rooftop reporting |
| VinSolutions Connect CRM | Franchise dealers and multi-rooftop groups | Enterprise-level reporting across rooftops, deep Cox Automotive ecosystem data from Autotrader, KBB, vAuto, and Dealer.com |
| DealerSocket CRM (Solera) | Independent and mid-size dealers who want flexible reporting | Custom dashboard and report building, equity mining alerts, executive pipeline visibility without manual data pulls |
| Tekion Automotive Retail Cloud (ARC) | Dealers who want a single, unified DMS and CRM database | Real-time reporting with no CRM-to-DMS sync lag, AI-driven forecasting and retention analytics |
| Salesforce Automotive Cloud | Enterprise dealer groups and OEM networks | Highly customizable dashboards, predictive lead scoring, multi-location benchmarking |
| DriveCentric | Dealers who prioritize live floor and activity visibility | Real-time pipeline and activity tracking built for sales-floor and manager visibility during the day |
Spyne Automotive CRM fits dealers who want that same reporting depth paired with AI-driven lead engagement, an automotive CRM with reporting dashboard option without the enterprise price tag or single-DMS lock-in of the Cox, Reynolds, or Salesforce ecosystems.
Best Automotive CRM With Real-Time Sales Reporting Dashboard
Real-time and periodic reporting are not the same thing, and the difference matters more than most dealers realize when comparing CRM demos. A real-time sales reporting dashboard updates as a lead comes in, a rep logs a call, or a deal moves stages, so what a manager sees at 10 a.m. reflects the morning’s actual activity. A periodic report, by contrast, is generated on a schedule, daily, weekly, or monthly, and describes activity that has already happened.
For high-volume and multi-rooftop groups, that lag is costly: a slow Monday lead response should not surface for the first time in Wednesday’s report. DriveCentric is frequently pointed to for live floor management, since a manager can watch pipeline activity and rep response as it happens during the day. Tekion takes a different route to the same result, running CRM and DMS on a single database so reporting has no sync delay at all. VinSolutions and DealerSocket both build dashboards meant to give leadership pipeline visibility without a manual pull, which matters most for franchise and multi-rooftop groups already inside those ecosystems.
Spyne Automotive CRM applies the same real-time principle at the individual dealership level, surfacing lead activity, response time, and pipeline movement on a live dashboard rather than a report a manager has to remember to run or a nightly batch job a manager has to wait on. For dealers specifically shopping for an automotive CRM with reporting dashboard depth at this level, that live update speed is the feature to test in a demo, not just ask about.
For dealerships that also want finance and insurance performance alongside sales activity, Salesforce Automotive Cloud and DealerSocket both extend their dashboards into gross profit and product attach rate reporting, though that depth typically comes with enterprise-level pricing and setup.
CRM Dashboard Strategies for Dealers
An automotive CRM with reporting dashboard only improves performance if the dealership builds habits around it. A few automotive CRM reporting tips worth adopting: assign one person, usually the sales manager or BDC lead, to review the dashboard at the same time every morning, not only when something goes wrong. Set a small number of dashboard views for each role instead of one dense screen everyone has to interpret differently.
Pair dashboard review with a short daily huddle so the numbers turn into action items rather than a screen people glance at. Revisit which metrics the dashboard highlights every quarter, since a metric that mattered during a slow season may not be the right one to lead with during a high-volume month. These CRM dashboard strategies for dealers cost nothing to implement and usually matter more than which platform a dealership picks.
Automotive CRM Reporting Best Practices
Beyond daily habits, a few automotive CRM reporting best practices separate dealerships that get real value from an automotive CRM with reporting dashboard from those that just have one installed. Keep report structures consistent across reps and rooftops so numbers are comparable month over month. Avoid customizing reports so heavily that no two managers are looking at the same underlying data.
Train new hires on the dashboard during onboarding, not months later, since a manager who never learns to read it will keep asking someone else to pull numbers manually. Treat dealer CRM analytics and reporting as a two-way conversation: if the dashboard consistently gets ignored, the fix is usually the report design, not the sales team’s discipline.
Common Mistakes Dealers Make With CRM Reporting Dashboards
The most common mistake when buying an automotive CRM with reporting dashboard capability is choosing based on dashboard screenshots during a demo, then discovering the real-time claim actually means it refreshes every few hours. Ask specifically whether dashboard data updates live or on a schedule before signing anything, and ask about leakage alerts, real-time flags for a delayed response or a stalled deal, since not every platform includes them.
A second mistake is building so many custom reports that nobody, including the GM, can say which number is the official one. Some dealerships skip mobile access entirely, which defeats much of the point of real-time reporting once a manager steps onto the lot. Many stores also set up the dashboard once at implementation and never revisit it as their sales process, team size, or lead sources change, ignoring basic automotive CRM reporting tips that would have caught the drift.
Spyne Automotive CRM: Automotive CRM With Reporting Dashboard Built for Dealerships
Spyne Automotive CRM is built for dealerships that want reporting and dashboard depth without adding a separate analytics tool or committing to a single DMS ecosystem. It centralizes lead capture, follow-up, and sales pipeline data, then surfaces that activity through a live dashboard rather than a report a manager has to schedule or export.
1. Real-Time Sales and Lead Dashboard
Spyne’s dashboard updates as leads come in and deals move through stages from new to won or lost, showing lead volume, response time, and pipeline stage without a manual refresh. A sales manager can see a stalled lead the same morning it stalls, not in next week’s report.
2. Role-Based Reporting Views
Managers, sales reps, and BDC staff each see a view built around their job, so a GM gets dealership-wide performance while a rep sees only their own leads and follow-ups. This keeps the dashboard useful instead of overwhelming.
3. Lead Source and Lost-Lead Reporting
Spyne tracks which channels, website, marketplace, social, or referral, generate leads that actually convert, not just leads that arrive, and shows which leads were lost so a manager can spot a pattern instead of guessing. A marketing manager can shift spend toward sources with real return instead of the highest raw volume.
4. Mobile Access to Dashboards and Reports
The same dashboard a GM checks at a desk is available from a phone, so pipeline health and rep activity stay visible from the lot, a trade show, or another rooftop.
5. BDC and Rep Performance Tracking
Spyne tracks response time, follow-up consistency, and close rate by individual rep and by BDC agent, giving sales managers a factual basis for coaching instead of relying on memory or spot checks.
6. Cross-Rooftop and Multi-Location Reporting
Dealers running more than one store can see performance by rooftop alongside a combined view, so a dealer principal is not logging into a separate system for each location.
7. Lead Stage and Funnel Visibility
Spyne shows exactly where each lead sits in the pipeline, from first contact through test drive, negotiation, and close, so a manager can see where deals are stalling without pulling a separate report.
8. Connected Reporting Across Lead and Follow-Up Data
Because Spyne keeps lead, follow-up, and communication data in one system, reporting reflects the full customer interaction history instead of a partial view built from disconnected tools.

Conclusion
Choosing an automotive CRM with reporting dashboard comes down to one question: does the data update while it still matters, or after the moment has passed. VinSolutions, DealerSocket, Tekion, Salesforce Automotive Cloud, and DriveCentric each answer that differently depending on the DMS ecosystem and dealership size they are built for, and ELEAD/CDK and AutoRaptor remain solid picks for Reynolds and Reynolds shops and smaller independents.
Spyne Automotive CRM offers that same real-time reporting and dashboard depth, built around dealer CRM analytics and reporting rather than static exports, without locking a dealership into one ecosystem. The dashboard itself is only half the answer. The CRM dashboard strategies for dealers and automotive CRM reporting best practices a team builds around checking and acting on it are what actually move sales numbers.