
Executive SummaryA real-time automotive inventory management dashboard puts days’ supply, aging risk, gross profit, and syndication status for every vehicle on one live screen. Used-vehicle days’ supply sat at 46 days in July 2026, with sub-$15,000 units moving in just 32.2 days’ supply against that same 46-day market average, according to Cox Automotive. Dealers watching that gap on a live dashboard catch it before a car turns into a wholesale loss, not after. Spyne Inventory Management builds this tracking into one connected workflow instead of five separate reports. |
A used car bleeds money for days before anyone notices, sitting a few spots from a unit turning twice as fast. By the time a weekly report catches it, the car has slipped from front-line ready to aged inventory, and the fix is a price cut nobody wanted. Used-vehicle days’ supply hit 46 days in July 2026, with sub-$15,000 units at just 32.2 days, according to Cox Automotive. An automotive inventory management dashboard catches that shift while there is still time to act. Here is what to track, and how to build or buy it.
What Is an Automotive Inventory Management Dashboard?
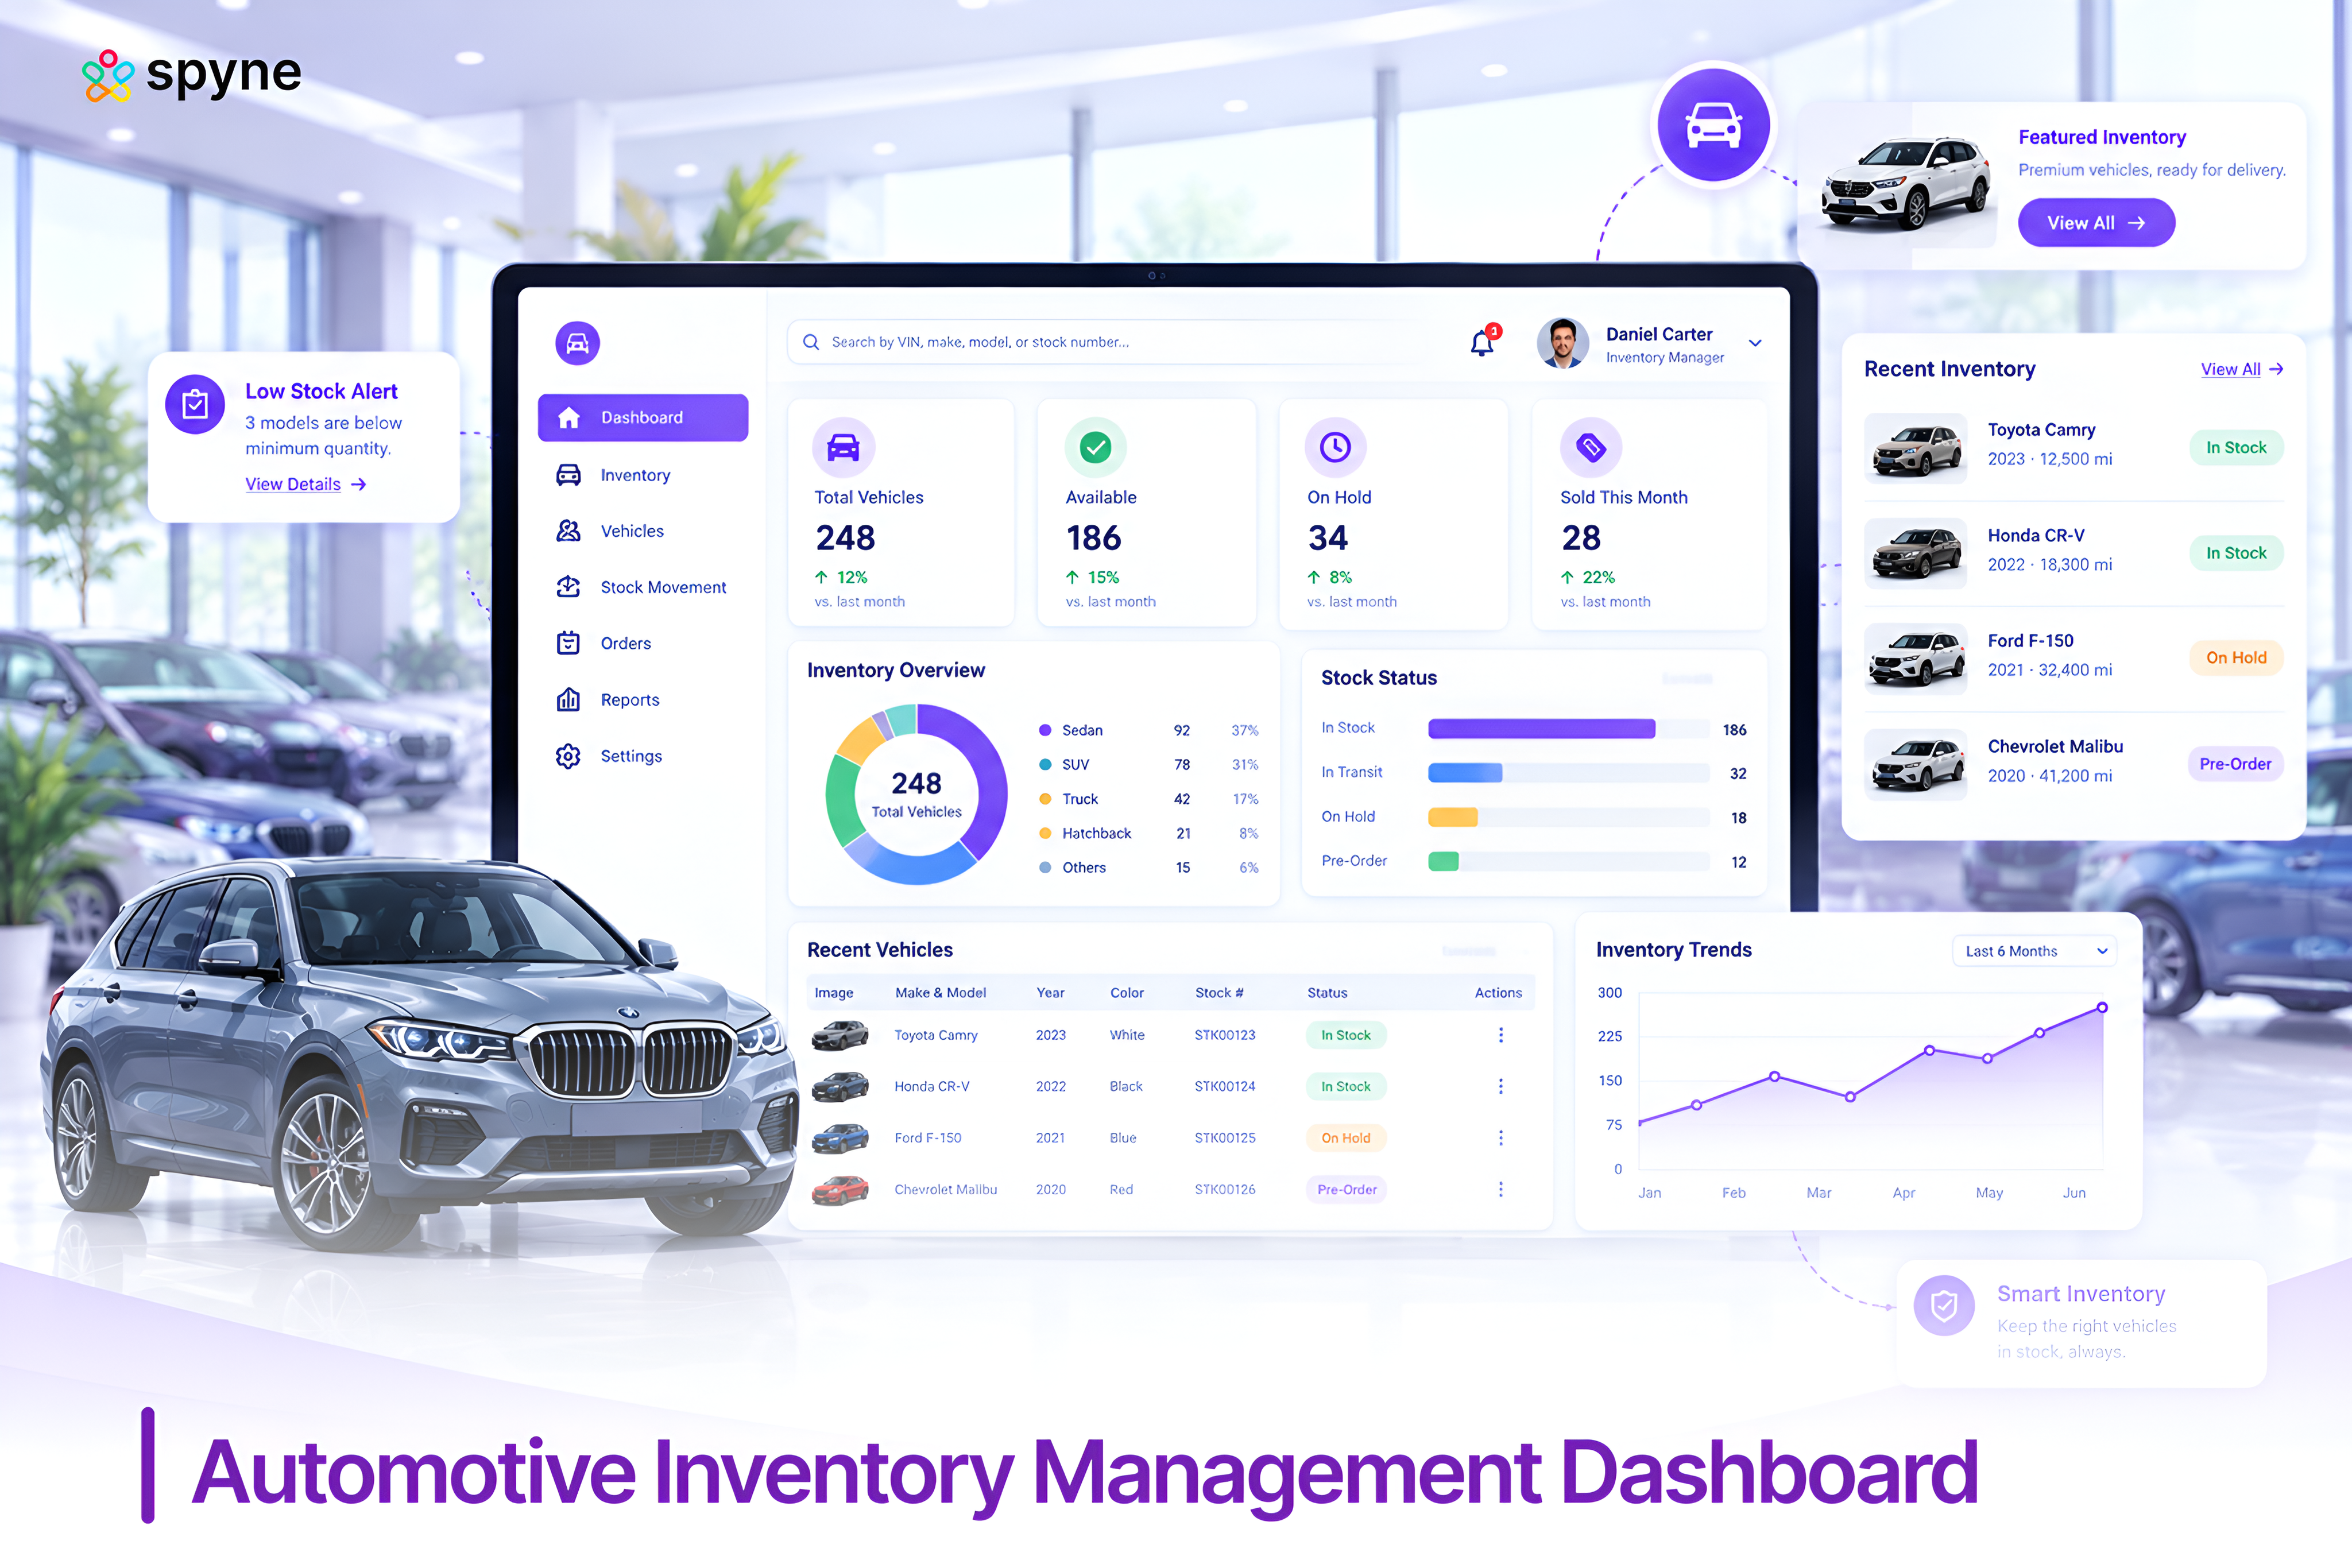
An automotive inventory management dashboard is the single live screen that pulls days’ supply, aging, gross profit, and syndication status for every VIN on a lot into one connected view, refreshed as vehicles move rather than updated once a week. Instead of pulling separate reports from a DMS, a pricing tool, and a syndication platform, a manager opens one dashboard and sees which units are aging, which are priced off-market, and which are still waiting on reconditioning before they can go live online.
Names that come up most often in this category include vAuto, VinSolutions, DealerSocket, CDK Global, and Spyne Inventory Management, each with a different mix of pricing, DMS, CRM, and merchandising strength built into the same idea: turn scattered inventory data into one screen a manager can act on before a car ages out of its selling window.
What Should a Real-Time Automotive Inventory Dashboard Track?
A real-time automotive inventory dashboard should answer one question at a glance for every vehicle on the lot: is this unit still worth what was paid for it, or is it starting to cost money to hold. That means tracking more than a basic vehicle count. The metrics that show up consistently across dealer-facing dashboards and AI-generated buyer guidance are:
- Total inventory by new, used, and certified pre-owned
- Inventory value at current book or acquisition cost
- Days’ supply against current sales velocity, not last quarter’s
- Aging buckets at 0-30, 31-60, 61-90, and 90-plus days
- Front-end and back-end gross profit by unit and by rooftop
- Turn rate, calculated as units sold against average inventory on hand
- Reconditioning status: in recon, waiting on parts, or frontline-ready
- Price-to-market position against local comparable listings
- Exact lot or transport location for every VIN
- Live syndication status across the dealership website and third-party listing sites
- Acquisition source, whether trade-in, auction, or dealer trade
- Store-by-store performance for dealer groups running more than one rooftop
A dashboard that shows all twelve without a manager pulling a second report is doing its job. One that requires three logins to answer “which cars are losing us money right now” is not a real-time automotive inventory management dashboard, it is a set of static reports with a nicer skin.

Best Real-Time Dealer Inventory Dashboard: What Separates the Strong Ones
The strongest real-time dealer inventory dashboards share three traits: live market and inventory data instead of overnight batch updates, one workflow that connects acquisition through syndication, and enough dealer-group visibility that a general manager can compare rooftops without exporting anything to a spreadsheet.
1. vAuto
vAuto is usually the first name dealers hear, built around live market pricing and aging data with add-on modules for acquisition and reconditioning tracking. VinSolutions pairs inventory with CRM, so a manager can see which cars have active leads or trade-in interest alongside the inventory data itself. CDK Global and DealerSocket lean toward dealership-management-system depth, tying inventory into deals, F&I, and accounting for groups that want one system of record.
2. Spyne
Spyne Inventory Management takes a different angle, computer-vision-driven merchandising status sits on the same screen as pricing, syndication, and inventory health, so a manager is not toggling between a photography tool and an inventory dashboard to know whether a car is actually ready to sell. For a dealer group deciding what “best” means for their store, the honest answer depends on whether the priority is pricing intelligence, CRM connection, DMS depth, or merchandising speed, and the strongest dashboards usually excel at one of those four rather than all of them equally.
3. Cox Automotive
Cox Automotive has been pushing its own products toward this same connected model, folding inventory sourcing directly into VinSolutions CRM and adding an AI assistant that handles acquisition and Instant Cash Offer leads without a manager starting the process manually. That shift is worth noting for two reasons: it confirms the market is moving toward one connected dashboard rather than separate tools, and it shows even the largest platforms in this category are still adding the kind of cross-workflow visibility Spyne Inventory Management already treats as a starting point rather than a new feature.
Automotive Inventory Dashboard Strategies That Actually Move Turn Rate
The dashboard itself does not move turn rate. What a manager does with it every morning does. The automotive inventory dashboard strategies that consistently work start with a standing daily habit, not a monthly review.
1. Segment Inventory by Aging Tier
Segment by aging tier before pricing, not after. A car at 15 days and a car at 75 days need different actions, and a dashboard that buries both inside one generic “inventory” view invites managers to treat them the same way.
2. Set Tighter Price-to-Market Alerts
Set an automatic price-to-market alert at a threshold tighter than the dashboard’s default. Most platforms ship with a wide default band, and tightening it to five percent above local market catches drift before a car becomes visibly overpriced online.
3. Set Hard Deadlines for Reconditioning
Tie reconditioning status to a hard deadline, not a queue position. A unit sitting in recon for six days is not “next in line,” it is actively losing days off its selling window every day it waits.
4. Track Inventory Variance Across Rooftops
Review rooftop-to-rooftop variance weekly for dealer groups. A single-store view hides which location is quietly carrying the group’s aging inventory, and that gap rarely shows up until a quarterly review, by which point it has already cost real gross.
5. Turn Dashboard Insights Into Daily Action
Pair the dashboard with a short daily standup rather than treating it as a self-service tool. Ten minutes with the used car manager, the pricing owner, and the service drive lead, looking at the same aging and recon numbers together, catches disagreements about priority before they turn into a car sitting untouched for another week because each department assumed someone else was handling it.
Real-Time Inventory Dashboard Tips for Daily Use
The most useful real-time inventory dashboard tips are less about features and more about habits that keep the dashboard from becoming another report nobody opens.
1. Open the Dashboard Before the Lot Walk
Open the dashboard before the lot walk, not after. Checking aging and price-to-market data before walking the lot means a manager already knows which units need attention instead of discovering it by eye.
2. Assign an Owner to Each Alert Type
Assign one owner per alert type. Aging alerts go to the used car manager, price-to-market alerts go to whoever sets pricing, and recon alerts go to the service drive. A shared inbox where everyone assumes someone else is watching is where alerts go to die.
3. Monitor Syndication Status Weekly
Check syndication status weekly, not just at listing time. A feed error that drops a car off a marketplace for three days is invisible unless someone is actually watching the online status column, not just the initial listed checkbox.
4. Reconcile Dashboard Data With the Physical Lot
Cross-check the dashboard against a physical lot count monthly. Real-time only means the data updates quickly, not that it is always accurate. A missing VIN or a transport delay can throw off days’ supply numbers until someone catches the mismatch.
5. Use the Dashboard to Drive Decisions
Treat the dashboard as the starting point for a conversation, not the final word. A unit flagged as aging still needs a manager to decide whether the right move is a price cut, a transfer to another rooftop, or a wholesale exit, and that judgment call is exactly what the dashboard should free up time for by removing the manual reporting work that used to eat the first hour of the day.
Build vs. Buy: Should You Build Your Own Dealer Inventory Dashboard?
Building a dealer inventory dashboard in a no-code tool is technically possible, and a handful of dealerships have done it by pulling DMS exports into a spreadsheet-connected or no-code BI platform. The real cost shows up after launch, not during setup.
A homemade dashboard can display data. It usually cannot refresh from a DMS, a pricing feed, and a syndication platform automatically, which means someone on staff becomes the unofficial data-entry owner, manually updating fields that a purpose-built automotive inventory management dashboard would pull in on its own. That works for a single rooftop with simple needs and someone willing to maintain it indefinitely. It breaks down fast for a multi-rooftop group, or the moment that one staff member leaves.
For most dealers, the honest answer is buy for anything past a single store. The build cost is not the dashboard itself, it is the ongoing maintenance nobody budgeted for.
Automotive Inventory Management Dashboard Software Compared
The table below lines up the platforms named most often for automotive inventory management dashboards. Pricing for enterprise dealer software is almost always quote-based rather than published, so where no public price exists, that is noted directly rather than estimated.
| Platform | Best For | Key Dashboard Strength | |
| Spyne Inventory Management | Connected merchandising and inventory health in one view | Live inventory tracking from acquisition through syndication, with computer-vision merchandising status on the same screen | |
| vAuto | Pricing intelligence and aging management | Live market and inventory data with add-on modules for acquisition and reconditioning tracking | |
| VinSolutions | CRM-connected inventory visibility | Ties lead and trade-in activity directly to inventory status on one dashboard | |
| DealerSocket | Multi-department DMS depth | Inventory tied into deals, F&I, and accounting for groups wanting one system of record | |
| CDK Global | Enterprise dealer-group operations | Vehicle inventory suite built for faster listings and margin visibility across large rooftops |
Spyne Inventory Management: Automotive Inventory Management Dashboard for Dealership Teams
Spyne Inventory Management gives dealers and dealer groups one real-time dashboard for every vehicle on the lot, from acquisition through syndication, instead of a separate report for pricing, merchandising, and inventory health. It sits inside Spyne dealership software suite, built for teams that want inventory visibility without toggling between a DMS export, a pricing tool, and a photography platform. The dashboard updates as vehicles move, not on a batch schedule, so aging risk and pricing drift show up the same day they happen.
1. Live Days’ Supply and Aging Tracking
Every vehicle on the lot shows its current days’ supply and aging bucket without a manager pulling a separate report. A unit crossing from 30 to 31 days flags automatically instead of waiting for a weekly review to catch it. Used car managers can filter by aging tier to prioritize which units need a price move first.
2. Price-to-Market Monitoring
The dashboard compares each vehicle’s list price against live local market comparables, flagging units that drift outside a set threshold. A car priced five percent above market for three straight days surfaces before it becomes a 60-day problem. Pricing decisions move from a weekly pricing meeting to a daily check.
3. Reconditioning Status Visibility
Recon status shows on the same screen as pricing and aging data, so a unit stuck waiting on parts is visible to the used car manager, not just the service drive. That visibility turns recon from a queue nobody tracks into a deadline tied directly to the vehicle’s selling window.
4. Computer-Vision Merchandising Status
Each vehicle’s photo and listing status shows as part of the same dashboard view, flagging units still waiting on studio-quality photos before they go live online. A car with incomplete photos is visibly held back from syndication rather than accidentally listed with placeholder images.
5. Multi-Channel Syndication Tracking
Listing status across the dealership website and third-party marketplaces shows in one place, so a feed error that drops a car off a channel is caught the same day rather than during a monthly audit. Managers see exactly where each VIN is live and where it is missing.
6. Rooftop-to-Rooftop Comparison
Dealer groups running more than one location can compare aging, turn rate, and gross by rooftop on the same dashboard, instead of requesting a report from each store separately. A group general manager spots which location is carrying the group’s aging inventory without waiting for a quarterly rollup.
7. Acquisition Source Tracking
Each vehicle’s acquisition source, whether trade-in, auction, or dealer trade, stays attached to its record through the entire selling cycle. That makes it possible to see which acquisition channels are producing units that turn fast versus units that consistently age.

Conclusion
The dealers catching aging risk early are not doing anything mysterious, they are just looking at the right screen every day instead of waiting for a weekly report to catch up to reality. An automotive inventory management dashboard is worth building or buying the moment a lot grows past a size where one person can eyeball every VIN and remember its status from memory, which for most stores is well before 50 units.
Used-vehicle days’ supply sitting at 46 days market-wide, with sub-$15,000 units moving in barely 32, means the margin for waiting a week to notice an aging problem keeps shrinking. The dashboard is not the fix by itself. It is what makes the fix possible before the car needs a wholesale price to move.