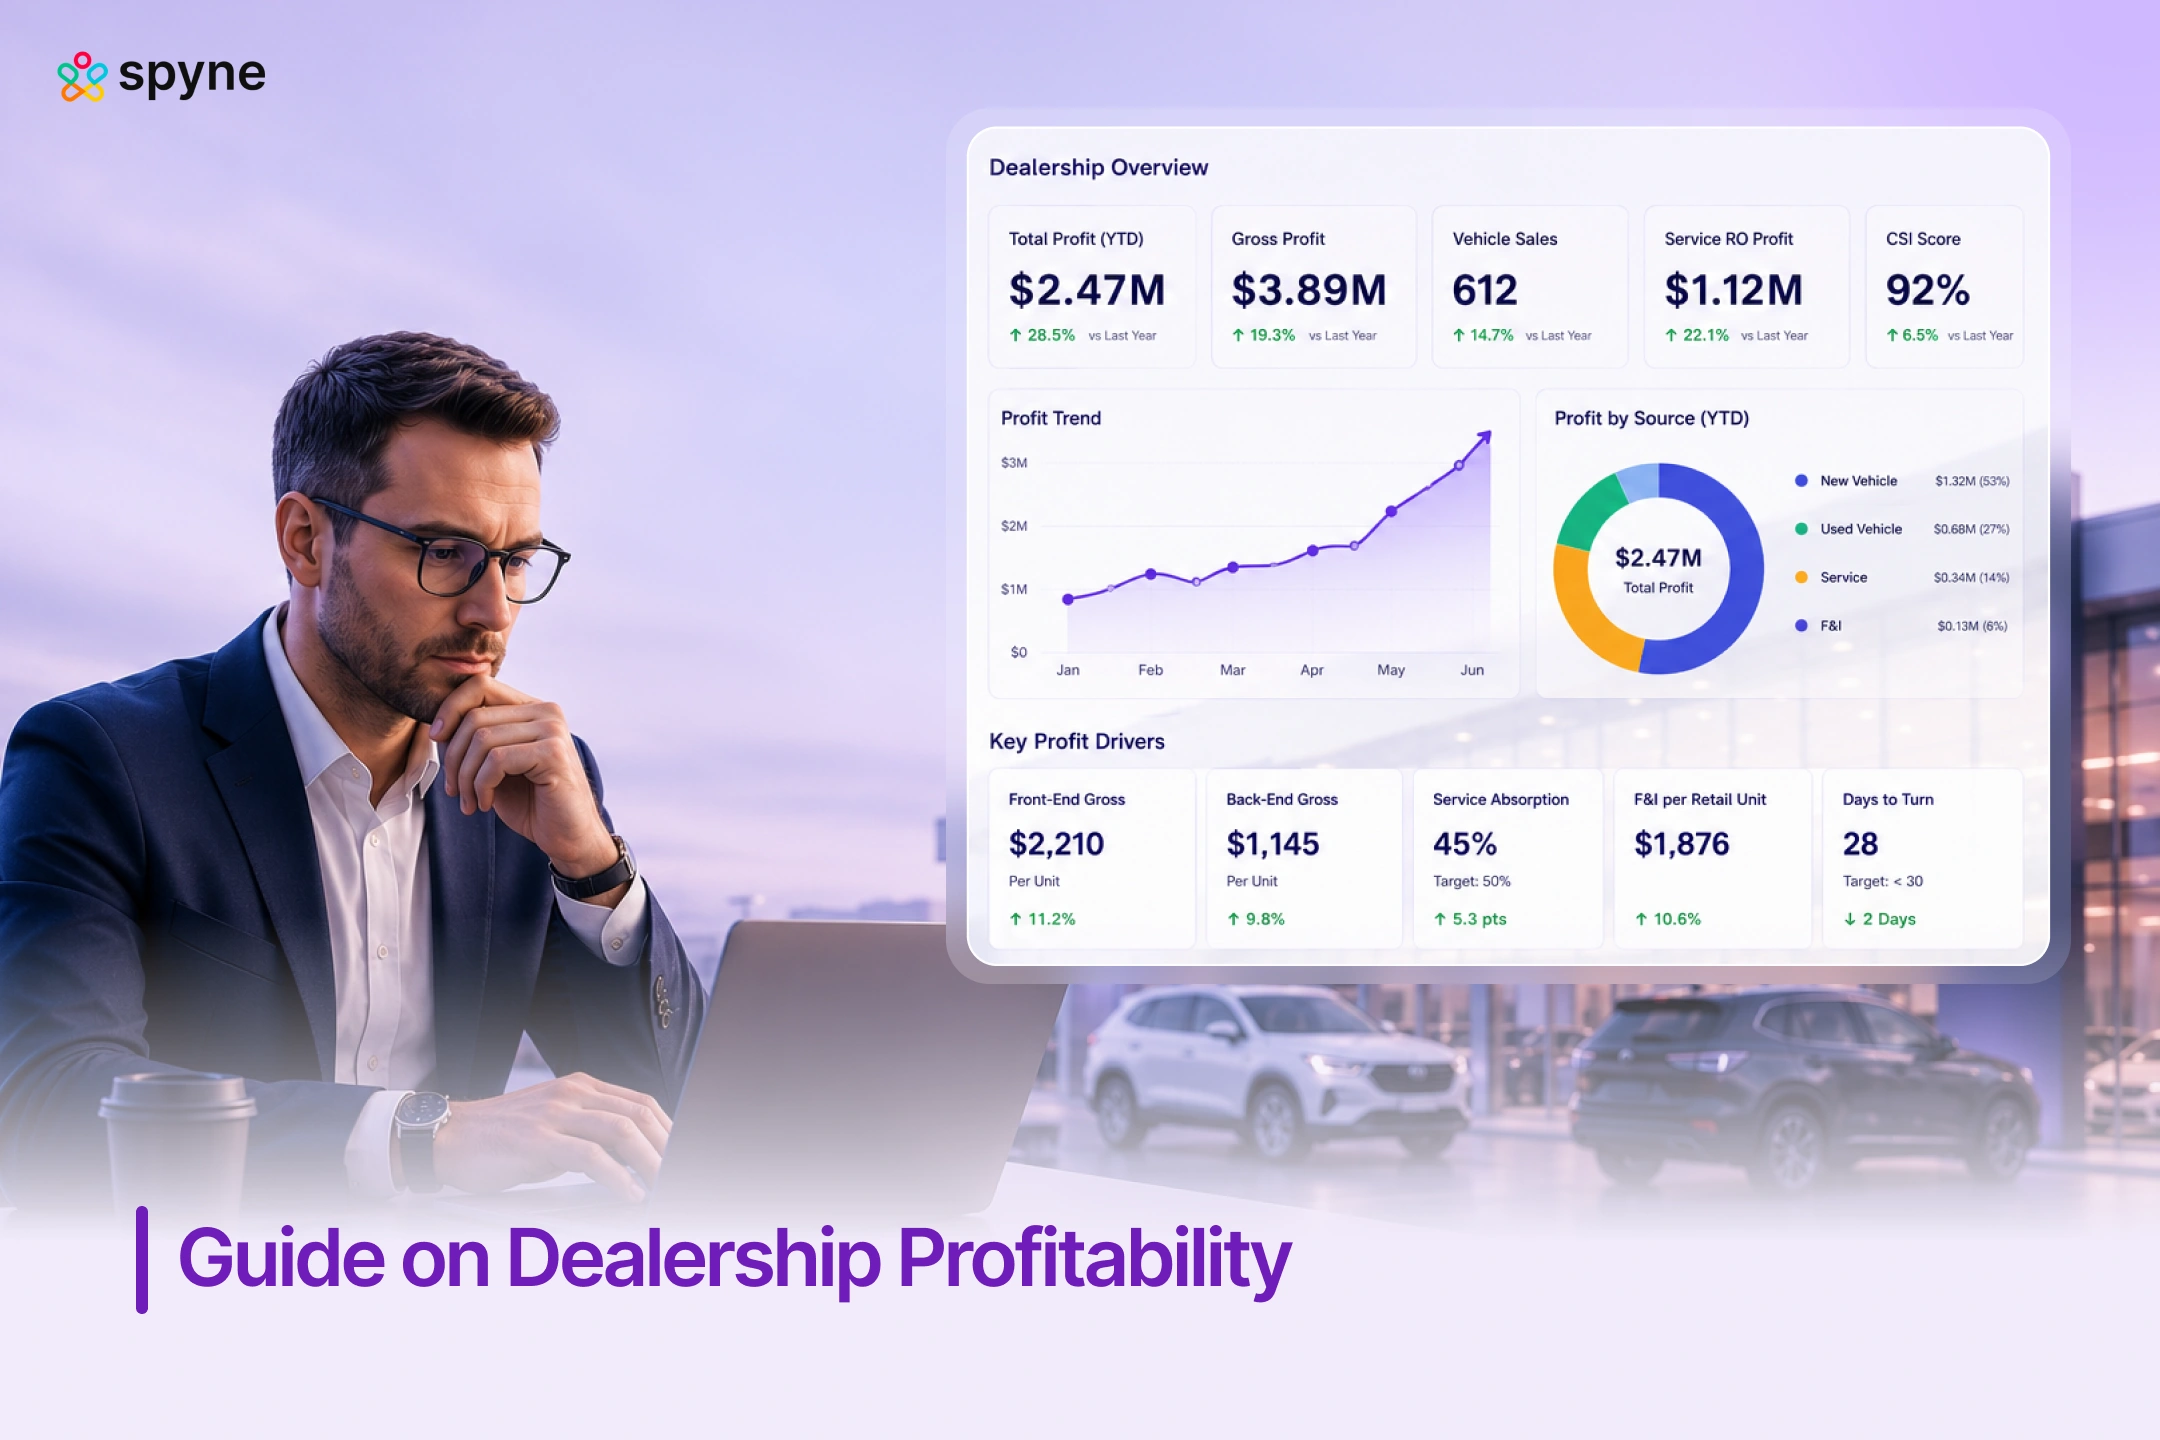

Car dealership profitability is one of the most discussed, and most misread, metrics in automotive retail. According to NADA, the average U.S. franchise dealership nets just 1.5–3% of total revenue. Yet when margins compress, the default response is almost always the same: sell more cars. In practice, the stores consistently outperforming their market aren’t doing it on volume. They’re doing it by closing the operational gaps where revenue quietly disappears, unanswered service calls, vehicles sitting unlisted for days, leads that age out waiting for a callback.
In this guide, we map the five profit leaks costing dealerships the most in 2026, attach a dollar amount to each, and walk through how AI tools, specifically Spyne’s Studio AI and Vini AI, close them.
The State of Dealership Profitability in 2026
The math is tighter than it’s been since 2019, and it’s moving in two directions at once.
Front-end gross is contracting. New vehicle gross profit fell at every major public U.S. dealer group through Q4 2025. AutoNation posted a two-year cumulative decline of 34.2% in total new GP dollars. Penske, 9.5%. Lithia, 13.8% (Stephens Inc., Automotive Retailing Industry Rankings, Q4 2025). Fixed overhead, floorplan interest, labour, software subscriptions, has not moved with it.
Fixed ops is filling the gap. Service and parts now account for 48–59% of total gross profit across the industry, up seven percentage points year over year (Presidio-NCM Q4 2025 Benchmark Report). U.S. franchised dealers wrote over 137 million repair orders in H1 2025, generating $81 billion in service and parts revenue (NADA Mid-Year 2025).
The stores holding above 3% margins have reorganised around this asymmetry. They treat service absorption as a primary metric, not a reporting one. Listing speed and VDP quality as direct cost levers, not marketing functions. And AI tools as operational infrastructure, to close the gaps between lead generation and appointment booking, and between vehicle acquisition and live listing.
Dealership Net Margin Benchmarks: What Separates Top Quartile from Average
The average U.S. franchise dealership nets 1.5–3% of total revenue in normalised market conditions. The difference between a 2% store and a 4%+ store is almost always service absorption rate and inventory turn velocity, not sales volume.
| Performance Tier | Net Margin | Service Absorption | Avg Days on Lot |
| Below average | < 1.5% | < 65% | 60+ days |
| Industry average | 1.5–2.5% | 65–75% | 45–60 days |
| High performer | 2.5–4% | 75–90% | 30–45 days |
| Top quartile | 4%+ | 90%+ | < 30 days |
On $300,000 in monthly fixed overhead, moving from 65% to 90% service absorption adds $75,000/month in gross profit coverage that was previously required from front-end sales. That is not incremental improvement. It is a structural shift in what the sales floor is required to produce before net margin begins.
The 5 Profit Leaks Costing Dealers the Most in 2026
Most dealerships have a general sense of where margin is leaking. Very few have quantified it. Below is each of the five most common leaks, with the cost calculated against typical store volumes so you can compare it to yours.
Leak 1: Slow Time to Listing
PROBLEM: Between vehicle acquisition and live listing, most stores average 3–5 days. During that window, the unit is invisible on every platform it would otherwise appear on.
COST: At $50/day in blended carrying cost, floorplan interest, insurance, and depreciation, a 150-unit store with a 4-day average listing lag accumulates $30,000/month in carrying cost on vehicles no buyer has yet seen.
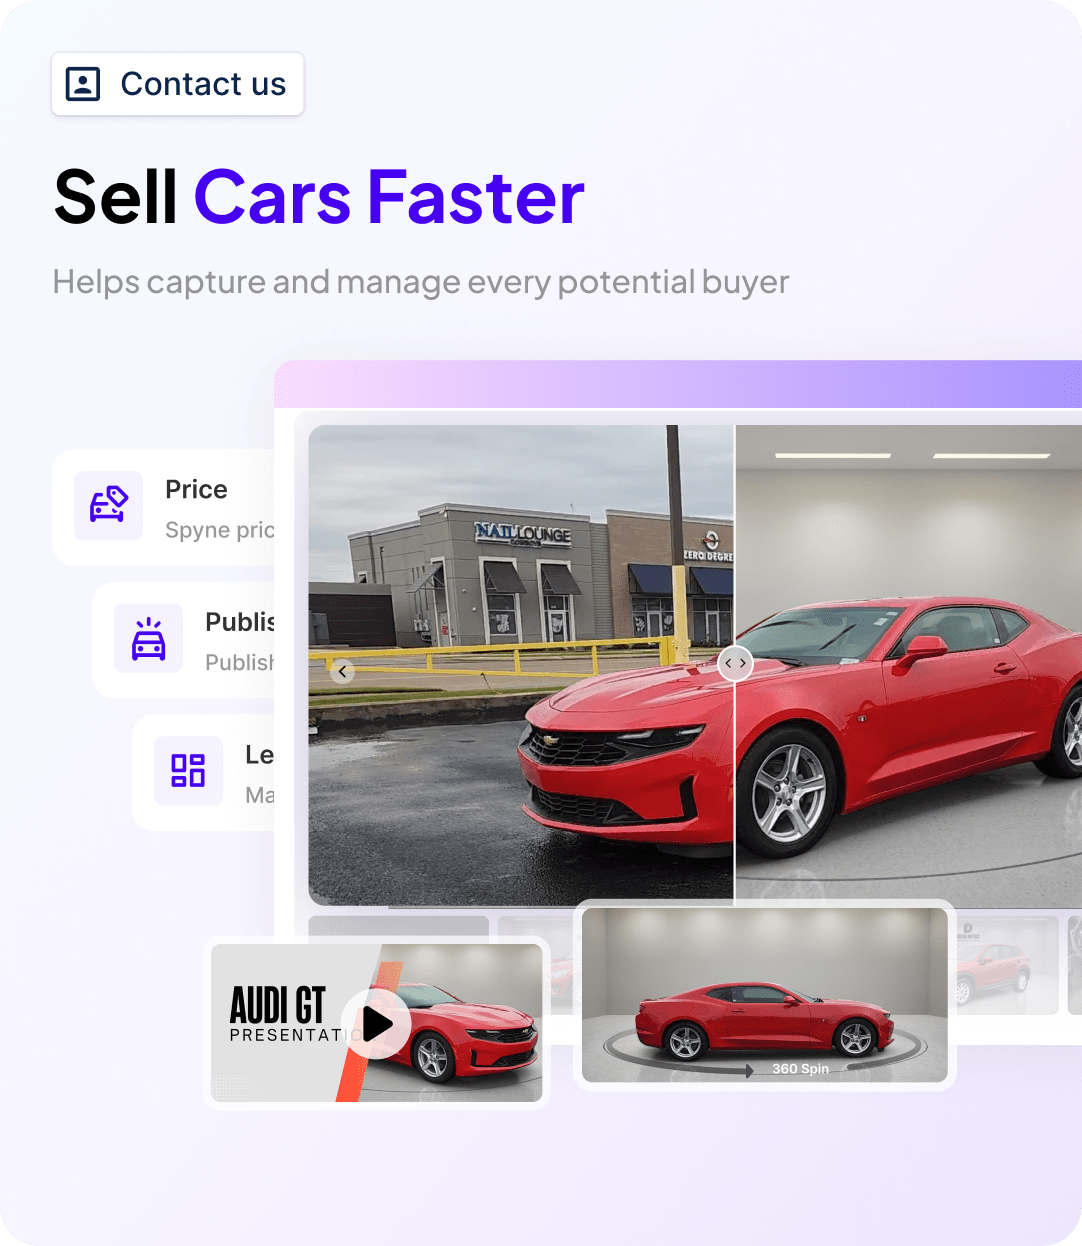
FIX: Reduce time-to-listing to same-day. Spyne Studio AI enables any lot associate to complete a full professional photo set in under 10 minutes. Background removal, lighting correction, and multi-platform formatting are handled automatically. No photographer, no studio, no lag.
OUTCOME: Moving from 4-day to 1-day average listing time on 150 units = $22,500/month in carrying cost recovered before any improvement in lead volume or days on lot.
Leak 2: Low VDP Quality
PROBLEM: Listings with fewer than 20 photos, inconsistent backgrounds, or poor lighting generate fewer leads per VDP view. Most buyers build their dealer shortlist from inventory photos before contacting anyone.
COST: VDP visitors who engage with photos are 16% more likely to submit an inventory lead (Dealer.com). A unit that doesn’t attract leads by day 30 typically sells for $500–$1,500 less by day 60, that price concession is the direct, measurable cost of poor merchandising on every aged unit.
FIX: Consistent professional-quality photos on every unit from day one, without incremental photography spend. Studio AI produces studio-grade visuals from photos taken on a standard phone, at scale across the full inventory.
OUTCOME: A 5-day reduction in average days on lot from improved VDP quality = $37,500/month in carrying cost saved on a 150-unit store. Price concession savings on aged units add further on top.
Leak 3: Unanswered Service Calls
PROBLEM: At peak hours, lunch breaks, and after close, inbound service calls go to voicemail or hold until the customer hangs up. Industry average missed call rate across dealership service departments runs around 23%.
COST: At 200 inbound service calls per week and a $450 average repair order, a 23% missed call rate represents approximately $20,700/month in unbooked ROs, before accounting for customers who book elsewhere and don’t return for their next service.
FIX: Vini AI answers 100% of inbound service calls instantly, routes appointments into the scheduling system, and logs every interaction into the CRM with full source attribution. No hold time, no voicemail, no lost repair order.
OUTCOME: Full call capture at a mid-size service department recovers $15,000–$30,000/month in RO revenue. Most stores recover more in month one than the annual platform cost.
Leak 4: Slow Sales Lead Response
PROBLEM: The average car buyer contacts 2.4 dealerships before purchasing (Cox Automotive). Response time is the tie-breaker. A lead that waits two hours has usually already scheduled elsewhere.
COST: At a 30–40% slow-or-missed response rate on inbound web leads and calls, a store receiving 50 leads per week is losing 15–20 qualified opportunities before a salesperson reaches them.
FIX: Vini AI responds to every inbound sales inquiry, chat, web form, or call, within 60 seconds, 24/7. It qualifies the lead, checks live DMS inventory data, and books the appointment directly into the CRM.
OUTCOME: Dealers using AI lead response see a consistent 20–25% lift in lead-to-appointment conversion. At a 15% baseline on 50 weekly leads, that’s 1.5–2 additional appointments per week from the same ad spend.
Leak 5: Floorplan Cost on Aged Inventory
PROBLEM: Most stores track days on lot as a reporting metric. Few calculate floorplan cost per unit per day and adjust merchandising or pricing against it proactively.
COST: A $40,000 unit at 7% annual floorplan costs $467 in interest alone over 60 days, before insurance or depreciation. On 15 units consistently held past 60 days, that’s $7,000+/month in floorplan waste before a single price concession is made.
FIX: Aggressive repricing and re-merchandising at the 30-day threshold. Studio AI enables photo refresh and campaign overlay updates without re-shooting, a new listing presentation on a stale unit at no incremental cost.
OUTCOME: Reducing average days on lot from 55 to 45 days on 150 units eliminates $75,000/month in combined carrying cost from floorplan, insurance, and depreciation.
Service Absorption Rate: The Fixed Ops Metric That Anchors Everything Else
Service absorption = (Service & Parts Gross Profit ÷ Total Fixed Overhead) × 100.
At 100%, service covers all overhead and every vehicle sold contributes pure profit. The national average sits at 64% (NADA, late 2025). Top-performing dealerships consistently exceed 100%.
For a dealership with $400,000 in monthly fixed overhead, here is what the absorption rate means in dollars:
- At 64% absorption: service covers $256,000. Front-end must produce the remaining $144,000 before any net margin exists.
- At 85% absorption: service covers $340,000. Front-end overhead gap drops to $60,000.
- At 100% absorption: the entire overhead base is covered. Every vehicle sold is a pure gross contribution.
That $84,000 monthly difference between 64% and 85% absorption doesn’t require more customers. It requires better operational execution on the customers already walking through the service drive.
| Absorption Rate | Overhead Coverage | Front-End Dependency |
| Below 65% | Low | High, front-end must cover 35%+ of overhead first |
| 65–80% | Moderate | Partial, some fixed ops cushion, front-end still required |
| 80–95% | Strong | Low, most overhead covered before first car is sold |
| 95–100%+ | Full | Minimal, front-end gross is entirely additive |
Three levers move absorption the fastest: inbound call recovery, average hours per repair order, and appointment show rate improvement. All three are addressable through dealership automation without adding headcount. Vini AI directly addresses the first, and through better booking consistency, the third. AI call answering for service departments typically moves missed call rates from 20–30% toward zero in the first 30 days of deployment.
How to Calculate the ROI of AI Tools for Your Dealership?
Most GMs ask about ROI before signing off on a platform. The answer isn’t a projection range, it’s a formula you can run against your own DMS data in five minutes.
Studio AI ROI: The Carrying Cost Calculation
Step 1: (Current average days to listing) − 1 target day = Days recovered per unit
Step 2: Days recovered × Monthly unit volume × $50/day = Monthly carrying cost recovered
Example: 4-day average → 1-day target, 150 units/month: 3 days × 150 units × $50 = $22,500/month in recovered carrying cost. Add VDP quality improvement (typically 4–7 fewer days on lot): 5 days × 150 units × $50 = $37,500/month additional. Total est.
Studio AI impact for this store: $60,000/month before any price concession improvement on aged units.
Vini AI ROI: The Call Recovery and Lead Conversion Calculation
Service: Monthly inbound calls × Missed rate × Booking conversion × Avg RO = Recovered revenue
Example: 800 service calls/month × 23% missed × 35% booking conversion × $450 avg RO: 184 missed calls × 35% × $450 = $28,980/month in unbooked service revenue recovered. (Estimated)
Sales: Monthly inbound leads × Slow response rate × Incremental conversion lift × Avg gross = Additional sales gross
Example: 200 leads/month × 30% slow response × 20% incremental conversion × $2,000 avg gross: 60 recovered leads × 20% × $2,000 = $24,000/month in additional front-end gross. (Estimated)
| Input | Studio AI | Vini AI, Service | Vini AI, Sales |
| Key variable | Avg days to listing | Missed call rate | Lead response rate |
| Cost per unit | $50/day carrying cost | $450 avg RO | Avg front-end gross |
| Monthly impact | $15K–$60K | $10K–$30K | $8K–$24K |
| Time to ROI | 30–60 days | 30–45 days | 45–90 days |
Spyne-deployed stores typically see 5–10x ROI within 90 days from recovered carrying cost and appointment conversion lift alone, not projected outcomes, but input-output calculations run against actual lot and call volume data.
Note: Results will vary by store volume, call traffic, and market conditions. The figures below are directional estimates based on industry averages, use them as a starting framework against your own DMS data. Get a free demo for more information.

Closing Thoughts
Front-end gross isn’t returning to 2021 levels. Floorplan rates won’t drop to pre-hike norms. In 2026, dealership profitability is decided in the operational gaps, the service calls that go to voicemail, the vehicles sitting unlisted for four days, the leads that age out waiting for a callback. Each one has a dollar amount. Each one is fixable.
Spyne’s Studio AI eliminates the listing lag and improves VDP quality at scale. Vini AI closes the missed-call and lead-response gap across both service and sales. Both deploy without retooling your existing DMS or CRM stack.
Want to see the carrying cost and appointment recovery numbers mapped to your specific store volume? Book a demo with Spyne.