
Having a dealership to run in today’s world is not just about inventory and vehicles, but much more beyond that. You need to configure what strategies are working for your dealership and what is not, and what areas need improvement. That is when you feel the need for a dealer performance report. Imagine having a report and dashboard for your dealership’s health. The dealer reports give a clear view of all your dealership operations and financial performance. In this blog, we will be simplifying these reports, how to measure them, and the key metrics you need to track. We will also help you to know how you can take your dealership to the next level by using these reports to grow faster and work smarter every single day.
What is a Dealer Performance Report?
The dealer performance report provides valuable insights into your dealership’s performance. It is based on top metrics and timelines. You can use the key automotive dealership benchmarks to analyze not only sales trends and region-wise revenue trends but also car dealership conversion rates and inventory management. It contains all the essential data, including sales, services, customer interactions, and more, which helps you fill the gaps in your dealership and make informed decisions for improved dealership outcomes. The dealer reports provide regular updates to your staff, keeping them accountable and focused on achieving the target. Besides this, you can plan strategies for growth with the help of these performance reports.

Understanding the Dealer Performance Report and How to Measure It?
No matter what size your dealership is, every one of you is familiar with reports and dashboards. The used dealer performance report is of no use when you don’t understand it properly and don’t know how to measure it. We will help you understand the reports to make the most out of them.
Understanding the Reports
1. Define Your Goal
Before jumping into tracking and exploring reports, you first need to define the success goals of your dealership. The goals are based on your business models. Once the real meaning of success for your dealership is clear, your team can put in efforts in the direction of your goals.
2. Choosing the Right KPIs
After setting up goals, it is important to choose the right KPI for automotive dealership to track your progress and identify areas that need improvement. You can consider the following factors to choose the right KPIs that align with your dealership’s goals:
- Customer satisfaction
- Sales target
- Employee retention
- Profit margins
You can get a clear picture of your dealer performance management by considering these factors for selecting the right KPIs to achieve your dealership’s missions.
3. Regularly Checking on the Performance
By regularly reviewing the KPI for automotive dealership, you can get actionable insights into your dealer performance. This way, you can determine areas of improvement, i.e., low sales, higher employee turnover, customer dissatisfaction, etc.
4. Discussing with Your Team
Besides analyzing and tracking the dealer performance report example, you must also communicate it with your team members to keep them motivated and accountable for your dealership’s goals.
Measuring the Performance Reports
1. Evaluate Performance Across all Departments
Looking at the reports solely isn’t enough; you must look at the reports across all departments, such as sales, finance, and service. This provides a complete overview of your dealership’s performance to identify strengths and weaknesses, thus helping you make informed decisions for better outcomes.
2. Analyzing Sales Data
By analyzing the sales data along with customer feedback and employee satisfaction, you can determine the key improvement areas for the betterment of customer service and employee training. Hence, this helps in driving sales to your dealership.
3. By Analyzing Historical Data
Evaluating current trends and historical data altogether can help you predict future performance and identify growth or risks in your dealership. As a result, you could make precise decisions about resource allocation and do strategic planning regarding operations.
4. Tracking Different Data
Finally, you need to track different types of data, such as sales data, marketing data, and market data, to improve your automotive operations and drive profitability.
Key Dealer Performance Report Metrics that Your Dealership Must Track in 2025
As a dealership owner, you must be aware of the right key automotive CRM metrics for your dealer performance report. These metrics are essential for customer satisfaction and increased operational efficiency. The following are 15 important key metrics you must track to stay competitive in 2025.
1. Sales Volume
This gives insights into the number of vehicles your dealership sold in a particular time. This shows your sales team’s performance.
2. Gross Profit per Unit
This measures the profit you gain on selling each vehicle individually. This can be calculated by dividing gross profit by the number of vehicles sold.
3. Gross Profit Margin
This metric is used to analyze the profit you made from sales. You can get this from the difference between the selling price and the cost of the vehicle sold.
4. Inventory Turnover Rate
This metric shows how fast your inventory is being sold. You can get this by dividing the total vehicles sold by the average number of vehicles in your inventory.
5. Service Revenue
It tracks the revenue generated by the service department of your dealership. It plays an important role in long-term profitability.
6. Parts and Accessories Sales
You can analyze the revenue generated by selling the parts and accessories in your dealership. Although this is a small equipment, but is an important source of income.
7. Customer Retention Rate
This metric helps you analyze the number of repeat customers in your dealership. This reflects your dealership’s reputation and the level of trust customers have in you.
8. Net Profit
The net profit helps you track the total earnings of your dealership. This can be calculated by excluding the total expenses from the overall revenue generated.
9. Average Transaction Value
This value measures how much your customers spend on average per transaction. This can be achieved by dividing the total value of transactions by the number of transactions.
10. Customer Acquisition Cost
The total cost of bringing a new customer is the customer acquisition cost. This is effective when the cost is low and customers are more.
11. Website Traffic and Engagement
Tracking the website traffic, engagement, and time spent by users on your website shows the efficiency of your online presence and how well you can attract customers.
12. Net Promoter Score
This is the measure of customer loyalty and satisfaction. This indicates how likely a customer refer your dealership to others.
13. Customer Lifetime Value
The lifetime value represents how much a customer spends over their relationship with your dealership. This indicates good services and retention.
14. Finance and Insurance(F&I) per Vehicle
The revenue generated from selling finance and insurance products with each vehicle is measured by this metric.
15. Lead Response Time
This measures how quickly your dealership contacts and engages with the leads. Thus, increasing the car dealership conversion rates.
How to Take Your Dealership Performance Report Strategy to the Next Level?
Your used dealer performance report is valuable for your dealer ratings only if it drives profit. Here are 4 tips you can follow to take your dealership’s reporting strategy to the next level and transform your performance reports into a proactive growth tool.
1. Understanding Your Dealership Beyond Sales
Your dealership needs to focus on much more than sales. You need to make sure your performance reporting is well integrated with your DMS and sales platform in order to get valuable insights and drive profitability.
2. Turning the Service Drive into Opportunities
You should track how your service drive supports revenue generation. It is important to look for their service drive to engage potential customers and acquire high-demand vehicles. Additionally, you must plan a strategy for a profitable service drive to convert unsold customers into potential buyers.
3. Maximizing Your Existing Customer Portfolio
Your dealership needs to follow a data-driven approach to explain your existing customer portfolio. Consistent communications over time through the service drive prevent customer defection and build customer loyalty.
4. Improving Sales Staff Performance Individually
As a responsible dealership owner, you must review your staff members individually. This gives you a record of the numbers of each salesperson and whether they are hitting their target or not. With this, you can get a scope of improvement for your sales staff if they lag.

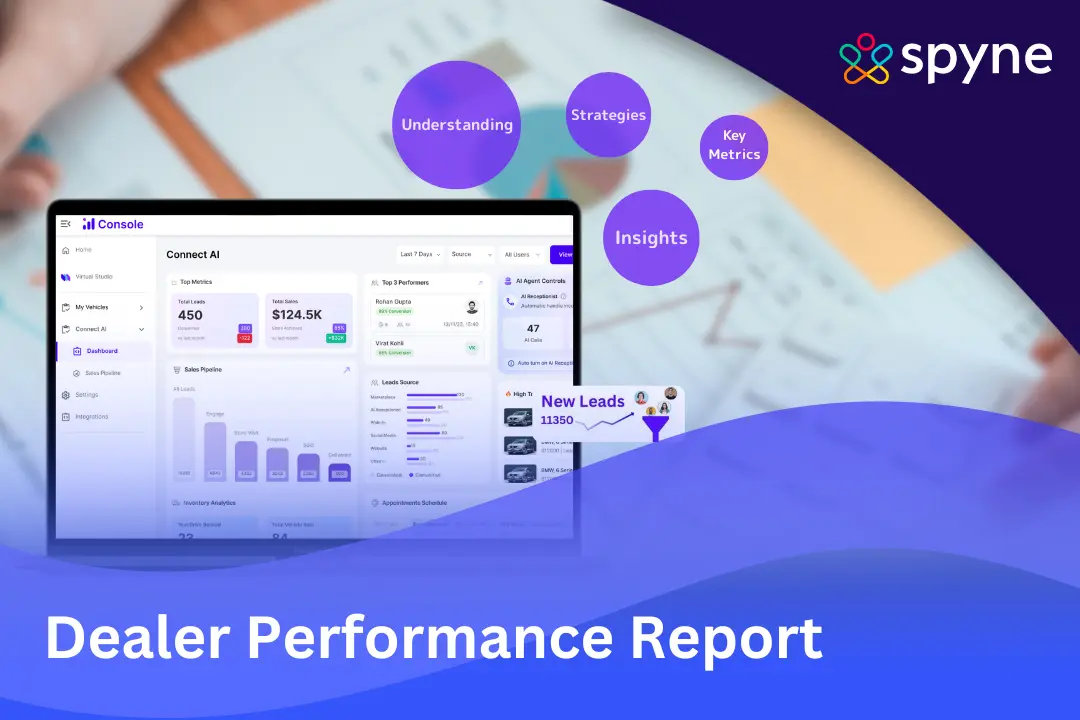
How Spyne Helps You with the Dealer Performance Report?
Spyne’s Retail AI is built in a way to simplify your dealership operations. Moreover, with smart automation tools, you can understand your dealer performance report, gain insights, and make powerful decisions for your dealership.
1. Real-time Performance Reports
Sypne provides real-time, updated performance reports for your dealership so you can know what is working for you and what is not. You can monitor your live performance without any delays.
2. Personalized Reports
We provide highly personalized reports for your dealership that align with your goals and objectives in order to help you understand them better and drive profitability.
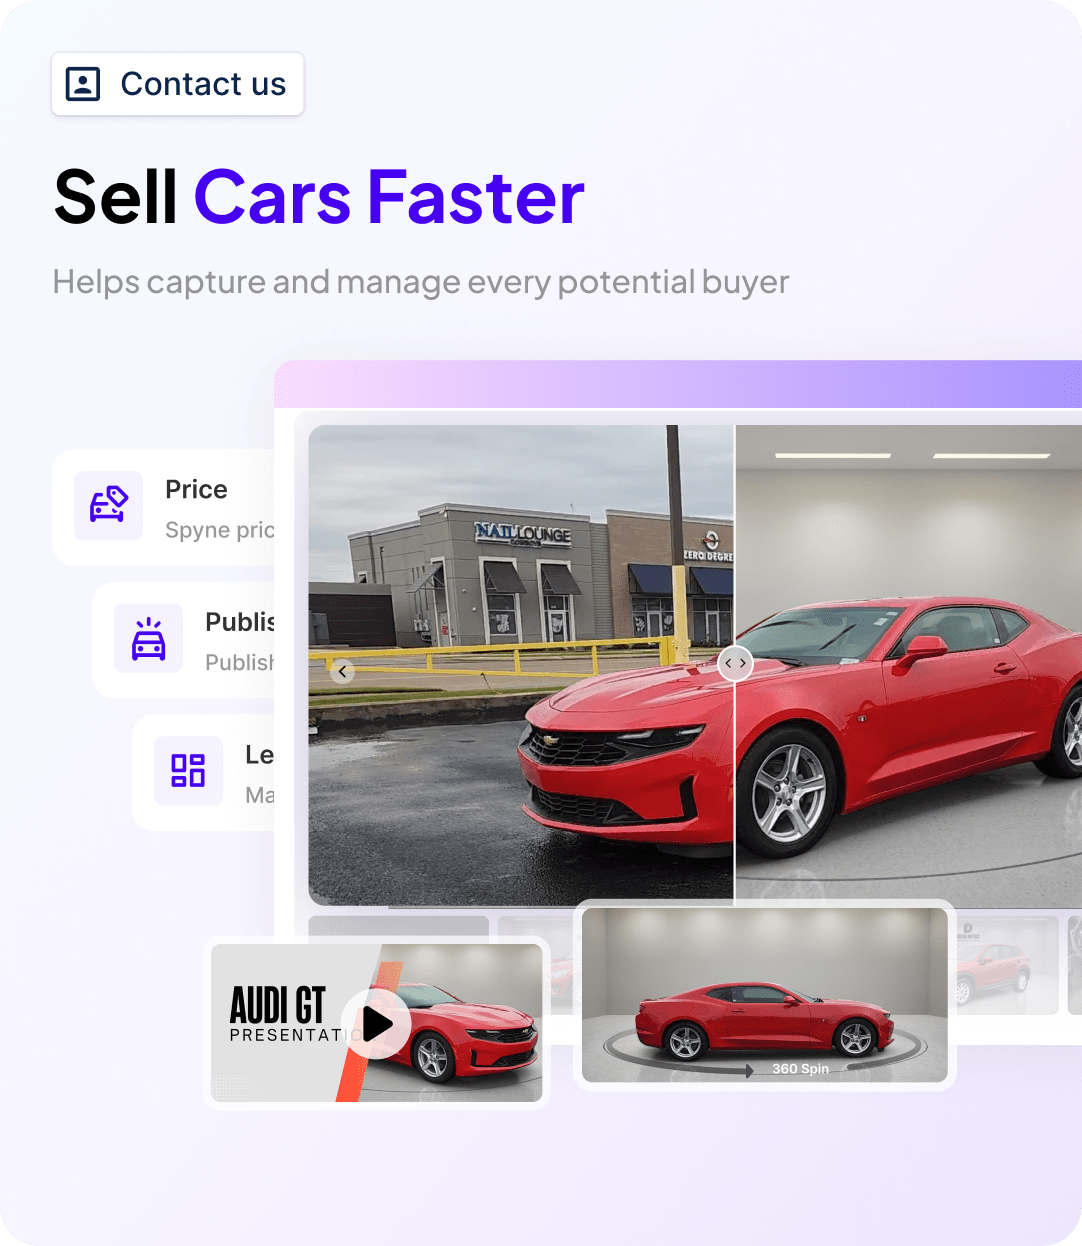
3. Effective Lead Capture
Spyne’s automotive lead management helps you capture and nurture leads from all sources, whether it is the website, social media, or calls. This ensures a timely response and higher car dealership conversion rates.
4. Round-the-clock Customer support
Since most of the customers contact your dealership after business hours, we provide AI-powered automotive chatbots and callbots to engage leads. This makes customers heard at all times and ensures no lead is missed.
5. SEO-optimized Websites
We provide your dealership with an SEO-optimized car dealer website to have a better ranking on search engines. Therefore, you can engage more leads and convert them into potential customers.
6. Follow up and Lead Engagement
Spyne never lets your dealership lose leads due to poor follow-up routines. Our automotive lead generation helps with automated lead responses and follow-up reminders to customers, thus keeping them engaged.
7. Seamless CRM and DMS Integration
Spyne provides a smooth automotive CRM integration with your existing dealership tools. Consequently, this helps to collect data from all the sources seamlessly and gives you a single dashboard for all your tasks.
Conclusion
A dealer performance report contains not only numbers but also the overall progress of your dealership. In this competitive world, tracking dealership performance isn’t just optional but is essential. This ensures you are not overlooking important metrics for your dealership that may impact your success. It is not enough to track just basic metrics and sales figures to measure your performance. Thus, your dealership needs to dive deeper into sales and data to get valuable insights. Spyne’s Connect AI solutions are infused with AI that helps your dealership work smarter, increase car dealership conversion rates, and streamline operations. We will help you make the most out of these reports and help your team to give its best. So, book a free demo with Spyne today and experience how this smart reporting technology can make a difference.