
| Executive Summary
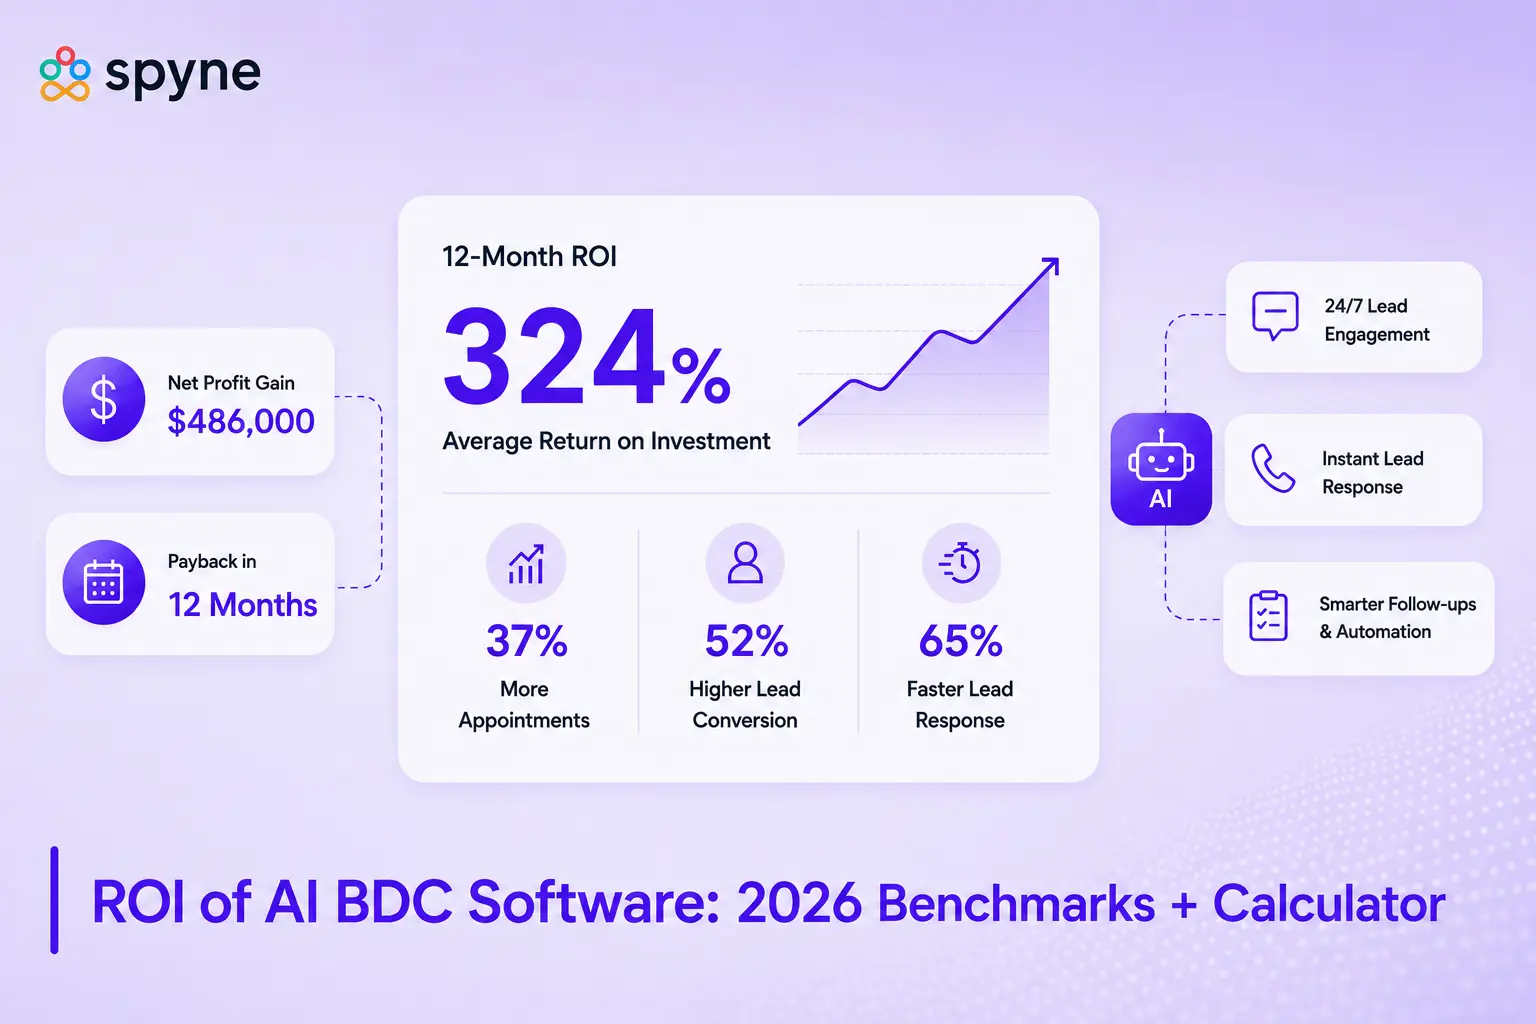
An AI BDC pays back when it recovers leads your team is already losing, not when it adds headcount. Vini AI recovered $310,000 in gross profit within a single week at Paragon Honda by closing the after-hours and peak-hour response gap. The math is simple: recovered contacts multiplied by your close rate and average gross, minus the software cost. Most stores clear payback within 60 to 90 days of going live. |
Your BDC isn’t understaffed because your managers hire badly. It’s understaffed because no shift schedule can realistically cover 168 hours a week without overtime that quietly erases margin. Car Wars’ 2024 analysis of nearly 3,000 dealerships found that average hold time hit three minutes and five seconds, and only 65.2% of calls actually connected, meaning close to a third of callers never reached anyone at all. This piece breaks down real AI BDC ROI benchmarks: a cost comparison across small, mid-size, and large dealerships, a sales-versus-service ROI ledger you can rebuild with your own numbers, a checklist for when the return is strongest, and the KPIs that actually prove it after deployment.
What ROI Can a Dealership Actually Expect From AI BDC Software?
Most dealerships see AI BDC software pay for itself within 60 to 90 days, and the return comes from recovered leakage rather than new marketing spend. A missed call, an unanswered text, or a lead left sitting overnight are all leads your dealership already paid to generate once. NADA’s 2024 financial data puts average revenue per repair order at $466, and McKinsey’s service-margin research points to roughly $210 to $256 in gross profit per recovered appointment once that revenue is booked. That range anchors every calculation later in this article, so it’s worth remembering as you read further.
What Does 24/7 Lead Coverage Actually Cost Without AI?
Round-the-clock phone coverage is expensive in a way most dealerships never calculate directly, because the cost hides across several line items instead of one visible bill. A single shift covers roughly 40 hours a week, so answering every call at every hour requires multiple overlapping shifts, not one additional hire. Industry benchmarks for a fully staffed, always-on BDC operation, including wages, benefits, management time, and turnover, typically land between $200,000 and $300,000 a year for one seat’s worth of genuine 24/7 coverage. That range still excludes recruiting costs, the technology stack, and the productivity gap that opens every time an experienced agent leaves and a replacement has to ramp up. This is exactly why most stores quietly settle for partial coverage instead: daytime staff, voicemail overnight, and a hope that tomorrow’s callback reaches the customer before a competitor does.
Segment Tiering: Cost and Break-Even by Dealership Size
| Tier | Monthly Leads (sales + service) | Traditional 24/7 Coverage | Typical AI BDC Cost | Break-Even Appointments/Month* |
| Small (under 100 units/mo) | 150 to 300 | Rarely justified at this volume | $1,000 to $2,500/mo | 4 to 10 |
| Mid (100 to 200 units/mo) | 300 to 600 | Two seats, roughly $400K to $600K/yr | $2,500 to $5,000/mo | 10 to 19 |
| Large (200 to 400 units/mo) | 600 to 1,000 | Three to four seats, roughly $600K to $1.1M/yr | $5,000 to $10,000/mo | 19 to 38 |
| Dealer Group (400+ units/mo) | 1,000+ across rooftops | Centralized, still $1M+/yr group-wide | $8,000 to $20,000+/mo per rooftop equivalent | Scales with volume |
*Break-even is calculated as monthly AI BDC cost divided by $260, the upper end of the NADA and McKinsey gross-profit-per-appointment range.
Small stores rarely justify a full in-house 24/7 seat, since the coverage math above doesn’t scale down gracefully to lower lead volumes. That’s exactly where AI BDC’s flat cost structure changes the underlying decision, because coverage cost stops multiplying by seat count once software replaces shifts.
How Do You Calculate Your Own ROI?
A single national ROI percentage is close to meaningless on its own, since every dealership’s call volume, close rate, and gross profit differ. What actually matters is running your own numbers through a consistent formula, then checking whether the result still holds up under conservative assumptions. Here’s the framework, broken into sales and service, since the two behave differently and blending them tends to hide which side of the business is actually driving the return.
Formula:
Incremental appointments/month = Calls × Missed rate × Bookable rate × Recovery rate
Incremental profit/month = Incremental appointments × Profit per appointment
ROI = (Incremental profit − AI BDC cost) ÷ AI BDC cost × 100
Sales-Drive ROI: The Speed-to-Lead Math
Sales-drive ROI comes from converting leads you’re already generating faster, not from buying additional leads.
| Input | Value |
| Monthly sales leads (internet + phone) | 500 |
| Current close rate | 10% (industry benchmark, 8 to 12% range) |
| Baseline units sold | 50 |
| Close rate with faster, consistent AI response | 13% |
| Units sold with AI BDC | 65 |
| Incremental units | 15/month |
| Average gross profit per unit | $2,500 |
| Incremental sales gross | $37,500/month |
The shift from 10% to 13% isn’t an arbitrary guess. Get My Auto’s dealer network reported a 32% surge in lead conversion after full AI integration, and DaveAI’s 2025 research found conversion improvements of 30 to 40% when AI is applied across the full sales funnel. A 30% relative lift applied to a 10% baseline lands almost exactly at 13%.
Service-Drive ROI: The Missed-Call Math
Service-drive ROI is usually the faster win to prove, since the booking cycle runs in days rather than weeks, and advisors are busy on the lane, not answering phones, during peak hours.
| Input | Value |
| Monthly service calls | 400 |
| Missed or unconnected rate | 35% (140 calls), based on the Car Wars 2024 benchmark |
| Bookable rate (appointment-seeking) | 40% (56 calls) |
| Recovery rate with AI BDC | 75% (42 appointments) |
| Gross profit per RO | $250 (NADA and McKinsey midpoint) |
| Incremental service gross | $10,500/month |
The Monthly ROI Ledger
The figures below are a worked illustration built from the sales and service assumptions above. They aren’t a guarantee, and they aren’t drawn from a single audited case study, so treat them as a template to rebuild with your own dealership’s numbers rather than a promise of results.
| Revenue/Savings Source | Monthly Value |
| Incremental vehicle sales (15 units @ $2,500 gross) | +$37,500 |
| Recovered service appointments (42 @ $250 gross) | +$10,500 |
| Labor reallocation (existing agents redirected, no new hires) | +$3,000 |
| Total Gross Value Restored | +$51,000 |
| Minus: AI BDC software cost (mid-tier) | -$5,000 |
| Net Monthly Return | +$46,000 |
| Illustrative ROI | ~920% |
This ledger uses the mid-tier assumptions from the segment table above, built on NADA, McKinsey, Car Wars, Get My Auto, and DaveAI benchmarks rather than a single dealership’s audited results. A small store running $1,500 a month in software against a smaller lead base will land at a lower dollar return but a comparable or higher ROI percentage, since the cost scales down faster than the recoverable leakage does.
Stress-Test Before You Present This
Run the ledger twice: once at your assumed recovery rate, and once at half that rate. If ROI still clears 150 to 200% under the conservative case, the number holds up under scrutiny in a budget meeting. Without CRM tracking that specifically tags AI-handled contacts, there’s no reliable way to separate AI-recovered gross from gross your team would have captured anyway.
Where Does AI BDC Deliver the Biggest ROI?
AI BDC ROI isn’t uniform across every dealership, since it scales directly with how much leakage already exists in your current process. The same software delivers a very different return at a high-volume store carrying a large coverage gap than it does at a smaller store with a tight, well-staffed BDC. Use the list below to gauge roughly where your dealership falls before running the calculations above:
- Lead volume of 300 or more per month across sales and service combined
- BDC staffed for business hours only, with no dedicated after-hours or weekend coverage
- A connection rate below the 65.2% Car Wars average, or simply unknown because it isn’t tracked today
- Multiple rooftops that need consistent coverage without adding headcount cost at every location
- A CRM full of dormant leads that never received a second or third follow-up attempt
If four or five of these describe your store, the ROI case is close to automatic. If only one or two apply, run the conservative half-rate stress test above before committing budget.
What KPIs Should You Track Before and After Deployment?
An ROI claim is only as credible as the tracking behind it, so pull these metrics for 30 days before deployment and compare them again at the 30-day and 90-day marks after go-live.
- Lead response time, measured from first inquiry to first reply, not first human reply. A realistic target is under five minutes for text and email, and under 10 seconds for phone.
- Contact or connection rate, the percentage of inbound calls that reach a live conversation rather than a voicemail or a dropped hold.
- Appointment set rate and appointment show rate, tracked separately, since a high set rate with a weak show rate usually points to a confirmation or reminder problem, not a booking problem.
- Lead-to-sale conversion rate, broken out by lead source so you can see whether AI-handled leads convert differently than human-handled ones.
- Cost per sold vehicle and cost per booked repair order, which turns the ROI conversation into a number a controller will recognize.
- Missed-call rate and after-hours booking volume, the two metrics most directly tied to the coverage gap this article opened with.
- Percentage of conversations resolved without human escalation, which shows how much repetitive volume is genuinely being absorbed rather than just logged.
- Dormant lead re-engagement rate, the share of leads older than 30 days that get reactivated into an active conversation.
- CSI or customer satisfaction score, since faster response and consistent follow-up should show up here within one or two quarters.
Without a documented before-and-after baseline on these nine, any ROI percentage presented to leadership is an estimate dressed up as a measured result.
AI BDC vs In-House BDC vs Outsourced BDC
Cost is only one axis of comparison between these three models, and it’s rarely the one that determines whether ROI actually materializes. The three approaches also differ in how consistently they handle volume spikes, how quality holds up as call volume grows, and what happens to response time the moment a human agent calls in sick. Here’s how outsourced vs AI BDC vs In-House BDC compare across the dimensions that actually move the ROI needle:
| Model | Annual Cost | Coverage | Connection Rate | Handles Volume Spikes |
| In-house (24/7 seat) | $200,000 to $300,000 | Business hours plus limited overtime | Roughly 65% average, 85% for top performers | No, calls queue once every agent is occupied |
| Outsourced (US onshore) | $48,000 to $84,000/yr (160 hrs/mo at $25 to $35/hr) | Extended hours, provider-dependent | Varies widely, and message-taking isn’t the same as resolution | Partially, depending on the provider’s own staffing depth |
| AI BDC (Vini AI) | $12,000 to $240,000/yr depending on tier | 24/7/365 across every channel, with no queue | Consistent by design, since the same process runs on every call | Yes, concurrent conversations without a queue forming |
The outsourced column carries a quality ceiling that’s easy to miss in a pricing comparison: an agent working from a script can’t check your live scheduler, your inventory, or your DMS. A customer asking whether a loaner is available gets a callback promise instead of an actual answer, and that gap is where a meaningful share of outsourced leads quietly disappear.
Deployment looks different depending on dealership structure:
- Single-rooftop dealership: Vini AI typically starts as after-hours and overflow coverage layered on top of the existing daytime BDC. This is where the leakage concentrates, and it’s also where staff buy-in is easiest to earn early on.
- Multi-rooftop group: The calculation shifts. Vini AI delivers identical coverage and response quality at every location without adding a manager or a separate shift schedule per rooftop. This is where the flat per-location cost advantage compounds fastest across a group-level P&L.
Where Does Vini AI Actually Change the ROI Math?
Vini AI changes the ROI math by converting hours your BDC is closed, or overwhelmed, into hours that still produce a booked appointment. At Paragon Honda, that shift recovered $310,000 in gross profit within a single week, driven mostly by leads and service calls that would otherwise have reached voicemail.
The mechanism behind that number:
- Response time: Vini AI answers in under five seconds, compared to minutes or hours for a human team working other calls or off shift.
- First-responder advantage: The dealership that responds to a lead first wins that deal roughly 78% of the time. A five-second response captures that advantage on every single lead, not just the ones a rep happens to reach first.
- Autonomous handling: Vini AI completes roughly 70% of routine sales and service conversations without a human agent stepping in.
- Service-lane lift: Vini AI lifts RO scheduling rate by an estimated 35% when it handles overflow and after-hours service calls, which is where a meaningful share of the Service-Drive ROI above actually comes from.
- Coverage, not headcount reduction: Existing BDC agents start each shift already caught up, working qualified leads instead of clearing an overnight backlog first.
That combination, first to respond, handled without escalation, and repeated at volume across both sales and service, is the real foundation behind the ledger shown earlier.
What Mistakes Cause Dealerships to Miscalculate AI BDC ROI?
Most flawed ROI cases share the same handful of errors. Check your own math against these before presenting it:
- Comparing software cost to payroll cost directly. A $3,000-a-month AI BDC quote looks expensive next to a $4,000-a-month BDC agent salary, until you remember the agent covers roughly 40 of the 168 hours a week that actually need coverage.
- Skipping CRM attribution. Without a tag or tracking number separating AI-handled contacts from human-handled ones, there’s no way to prove which conversions the software actually caused.
- Running the math once and never again. Lead volume, close rates, and staffing all shift over a year, so a case built on month-one assumptions can look very different by month nine.
- Using a national close-rate average instead of your own. Applying an 8 to 12% industry benchmark when your store closes at 6% or 15% skews every downstream number in the calculation.
- Ignoring bookable rate. Not every missed call was a lost appointment. Treating all missed calls as recoverable revenue overstates the case and invites pushback in the budget meeting.
- Counting the same recovered lead twice. Sales and service math can double-count a customer who called about a trade-in and also booked a service appointment in the same conversation.
- Presenting the optimistic case only. A single ROI number with no conservative or stress-tested version attached rarely survives scrutiny from a controller or a skeptical GM.
How Do You Evaluate an AI BDC Vendor’s ROI Claims?
Ask any vendor for the full chain from total call volume to bookable calls to booked appointments to actual gross profit, not just a headline percentage. A vendor who can only show a final ROI number, without the underlying call and conversion data behind it, is asking you to trust a conclusion you can’t verify. Request the following before signing anything:
- Average response time under real conditions, not a scripted demo call
- Percentage of conversations resolved without human escalation
- How the system handles concurrent volume, such as ten simultaneous calls during a Monday morning spike
- At least one reference dealership close to your own size, brand mix, and lead volume
- A documented attribution method, showing exactly how the vendor separates AI-driven conversions from conversions your team would have closed anyway
- A written breakdown of what’s included in the quoted price, since platform fees, usage costs, and integration fees are often billed separately
A vendor confident in their own numbers will produce all six without hesitation or a follow-up sales call.

Closing Thoughts
AI BDC ROI isn’t a forecast; it’s arithmetic built from leads your dealership is already generating and quietly losing. Every month without coverage, that leakage compounds while a competitor’s phone gets answered instead of yours. Before your next budget meeting, run the ledger above against your own call volume, close rate, and gross profit, then stress-test it at half the assumed recovery rate. If the math still holds, this is one of the highest-return line items available on a dealership’s P&L today. See what Vini AI recovers in your first week: book a demo with Spyne.