
The used car market is a giant, constantly shifting landscape. Whether you’re looking to buy or sell a pre-owned vehicle, understanding the used car buyer demographics/statistics is crucial. This blog dives deep into the fascinating world of used cars. Exploring everything from global market size to the demographics of typical used car buyers. We’ll uncover the reasons behind the market’s growth, analyze consumer behavior, and see what the future holds for this ever-evolving industry.
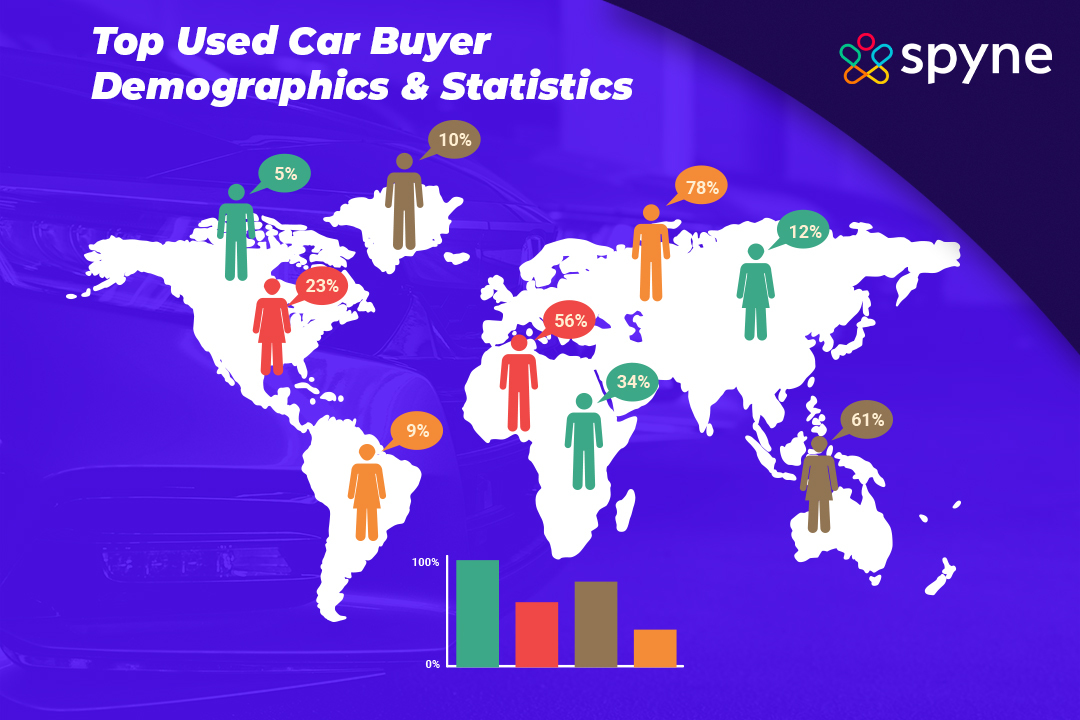
What is Used Car Buyer Demographics?
Used car buyer demographics refer to the characteristics of people who purchase pre-owned vehicles, including age, gender, income level, education level, and location. The age of shoppers varies extensively, from young adults to older individuals seeking dependable transportation. each male and females make a contribution to the market, and income ranges span from decrease to better brackets. education influences choices, and geographical vicinity plays a huge role in consumer choices. information these demographics permits organizations to tailor their products and marketing processes to efficaciously target extraordinary segments of the used vehicle marketplace.
Distribution of New And Used Car Buyers Demographics In The United States, By Gender
According to a Cox Automotive survey, new and used car buyers in the US were almost evenly split by gender in 2022. Females accounted for 51% of new car buyers, while males made up 49%. Conversely, females represented 49% of used car buyers, with males comprising 51%. Interestingly, household income emerged as a significant factor influencing car purchases. A substantial 67% of new car buyers reported incomes exceeding $75,000, indicating a preference for higher-end vehicles.
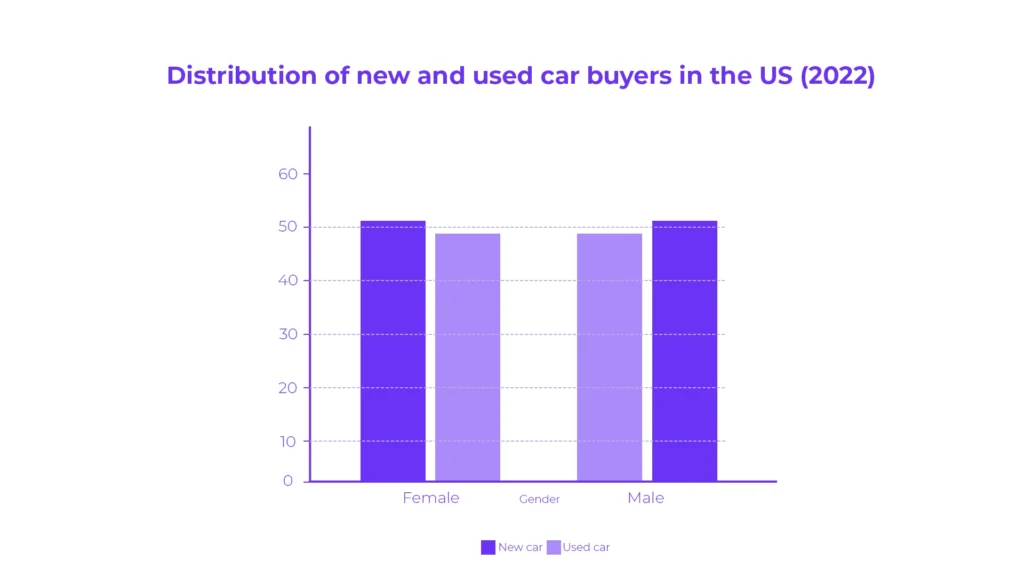
In contrast, 55% of used car buyers fell within the same income bracket, suggesting a more budget-conscious approach to purchasing a vehicle.

Distribution of New And Used Car Buyers Demographics In The United States, By Age Group
The distribution of new and used car buyers in the United States varies significantly among different average ages of new car buyers and used car buyer groups. Buyers aged 24 and younger make up a mere 1% of the market, while the largest portion of buyers falls within the age range of 25 to 54, accounting for 55% of the total market share.
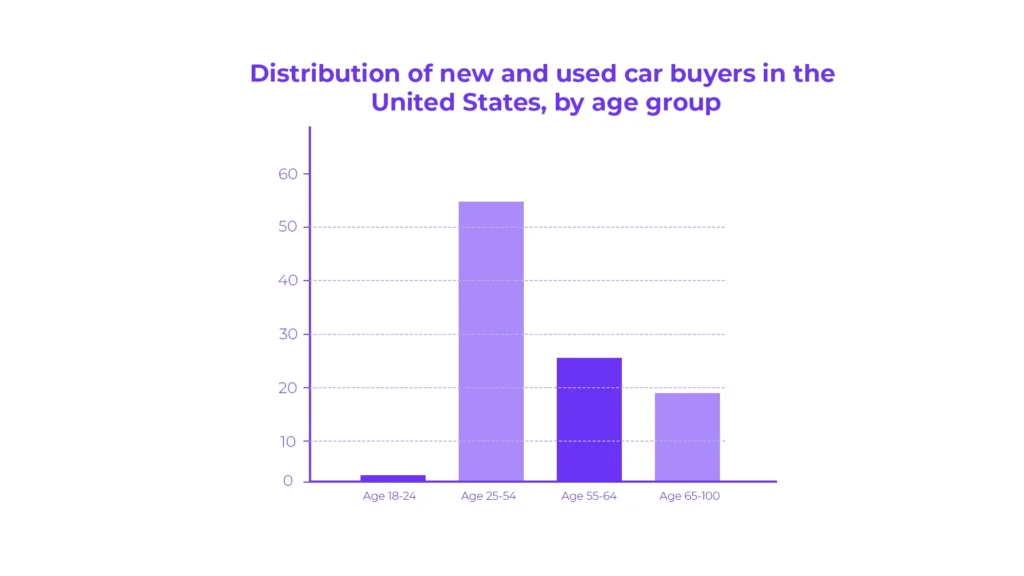
Individuals aged 55 to 64 represent 25% of buyers, and those aged 65 and older make up 19% of the market.
Statistics on How Consumers Shop for Cars
Let’s explore the latest statistics on how consumers shop for cars. It is highly crucial to understand consumer behaviour and trends let’s explore these statistics:
Online Research Behavior
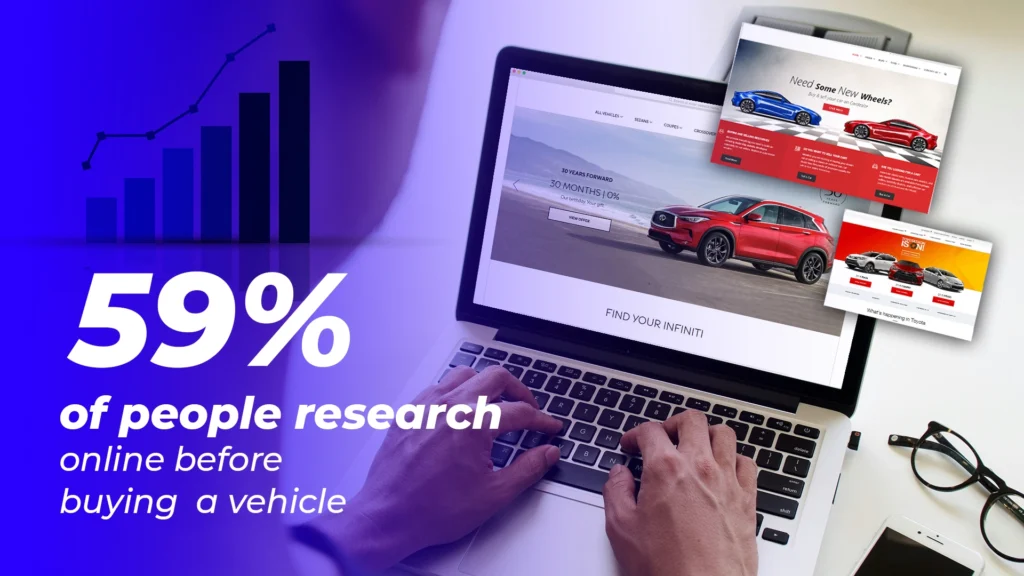
1) On the web, 59% of automotive buyers are spending their time researching vehicles, with 46% also multi-tasking using different devices.
2) The most widely used medium for research online by car buyers is referred as third-party sites, with 78% using them.
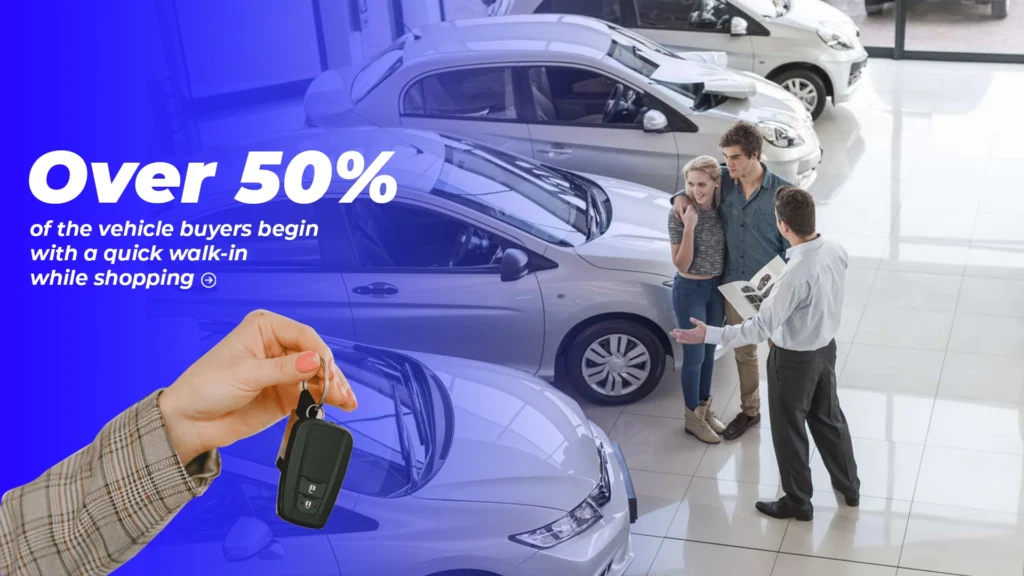
3) Over 50% of the vehicle buyers begin with a quick walk-in while shopping.
4) 60% of engaged shoppers find themselves being lost with too many options to choose from.
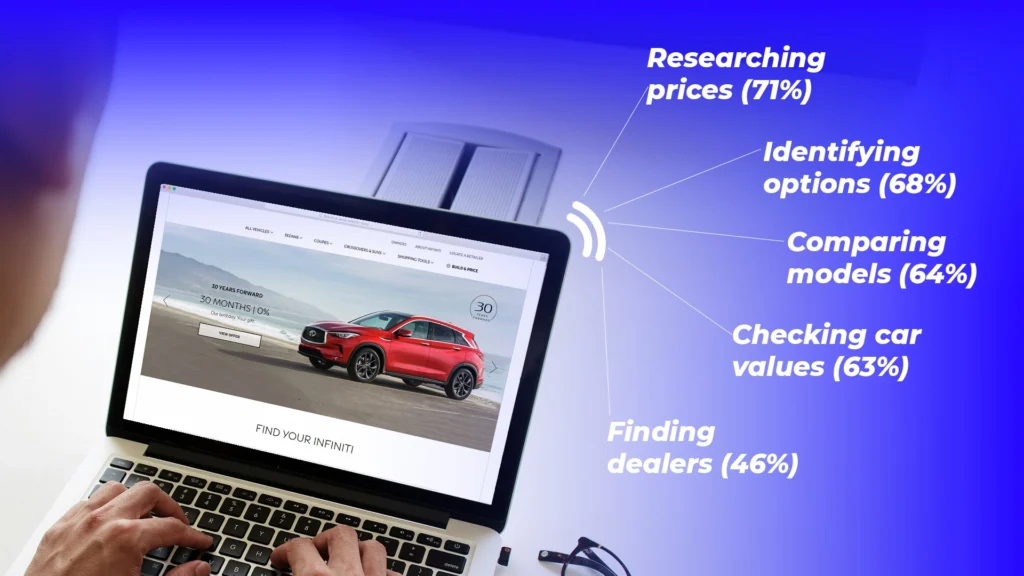
5) A study of the most frequently executed behaviors online in the context of car buying indicates the following list:
Researching prices (71%)
Identifying options (68%)
Comparing models (64%)
Checking car values (63%)
Finding dealers (46%)
Customer Satisfaction and Preferences
6) Customer satisfaction with the overall test-drive process is scored as high as it (81%) and drops down as low as 67% due to the F&I portion of the visit.
7) Social media popularity among car internet shoppers is mounting, and 22% of people currently are applying this tool for research.
8) Although 33% say that social media is indeed a factor at the point of purchase, 13% say that it doesn’t.
9) The percentage of new-vehicle buyers who share their purchase on social media goes up to 34 and the platform for this is majorly Facebook (88%).
10) Automobile smartphone online search is growing and bringing in Websites more than tablets (53% vs 33%).
11) It is the smartphone that provides an edge over others, as it is used by 53% of automotive internet shoppers during research.
12) Things consumers like in giving the answers to the questions are buying and selling cars from home and purchasing without test drives. They like them at 54% and 42% respectively.
13) Amongst 42% of respondents indicate that they can buy a car without a test drive if there is a warranty.
14) Mobile app integration significantly raises customer loyalty and boosts the level of their spending.
15) Though their responsiveness has much to do with it, dealers and OEMs can still work on the speed of their response to customers.
16) Automotive dealers with their own brands employ apps to boost sales and keep service in mind.
17) Automotive executives believe that insights from the digital ecosystem will be the key to making more revenue than only providing hardware.
18) Quality is what gets a brand talking among consumers, according to 30% of respondents 85% of automotive executives think that in the future it’ll be easier to make money on digital services than on hardware products.
Consumer Discomfort and Behavior Insights
19) Over half of Americans state they are unhappy with car shopping at showrooms, raising recurrent anxiety (87%) and feeling taken advantage of (52%).
20) Gen X-ers and millennials feel anxious about requesting advertisement rate reductions in personals.
21) A third of all members of the Gen X sample would rather experience a root canal than talk about a vehicle purchase.
22) 56% of millennials, prefer to clean the house rather than negotiate with a car salesperson.
23) Surprisingly, more than 72 percent of respondents from this younger cohort of millennials would refer to their lifestyle centered around having a car, especially for a social aspect.
Social Media Influence and Content
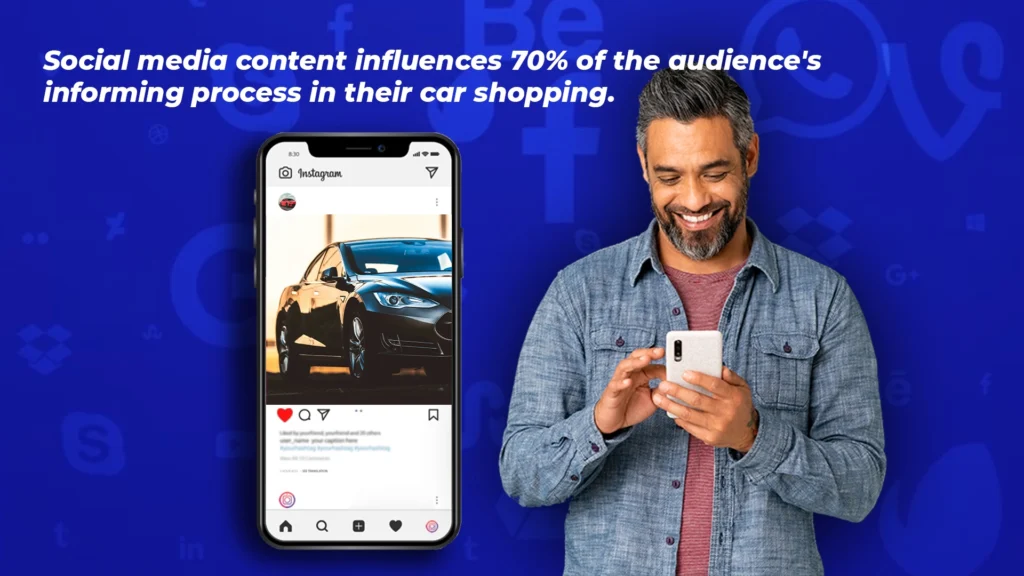
24) Social media content influences 70 percent of the audience’s informing process in their car shopping.
Consumer Behavior Insights
25) 42% who were respondents declared they would rather consider owning vehicles that run themselves or even choose to purchase the cars in certain conditions if they are under warranty.
Used Car Buyer Statistics Automotive Marketers Need to Know in 2025
It is essential to understand car buying statistics more than 70% of consumers who own cars start their shopping journeys online, not at dealerships. On average, automotive marketers spend 33% of their total automotive digital marketing budget on digital advertising. Relatively 90% of all consumers use smartphones to compare vehicles on the spot.
State of The Used Car Market
The used car market is currently experiencing a few major trends:
Demand: Used car demand is strong, with items such as:
- Lack of new cars: The low availability of new cars due to chip shortages and supply chain issues has pushed people into the used market.
- Rising prices: Average used car prices have risen sharply in recent years due to high demand and limited supply.
Growth: The used car market will continue to grow in the coming years, with some analysts forecasting a global market size of $2.7 trillion by 2030 [used car market size, share, growth research report in 2030].
Online car transfers: With more and more used cars being sold online, consumers are more comfortable buying cars without seeing them.
Finance: Finance is a key factor in buying a used car, and average monthly payments also go up.
Local differences: Used car market conditions can vary depending on your location. If you want a specific image, you may want to consider researching trends in your area.
How Data And Analytics Can Capture Value?
Data and analytics capture value by understanding customer needs. Analyzing customer data allows companies to customize experiences. In analytics, powerful questions are critical for guiding data pre owned vehicle market analysis and decision-making based on KPIs (Key Performance Indicators). KPIs provide context for these questions and track business performance. By measuring leading and lagging indicators, companies can assess past performance and predict future trends. This data-driven approach helps businesses improve by focusing on what matters most.
Used Car Buyer Statistics Overview
Discover the fascinating realm of used cars with this brief look at global car dealership statistics for used car. Therefore, from how many are sold to how people buy them, we’ll explore the basics of what’s happening in the world of pre-owned vehicles. Let’s dive in and see what’s driving the market!
Market Overview:
The global used car market is valued at over $1 trillion in 2021 and is expected to grow to $2.7 trillion by 2030, driven by factors like increasing disposable income and the appeal of affordability.
- Sales and Trends:
- In 2020, approximately 39.3 million used vehicles were sold in the US, surpassing new car sales.
Online sales are thriving, with over 3 million used cars sold online in 2021, reflecting the growing trend of digital car buying.
- Consumer Behavior:
- Financing is common, with around 75% of used car buyers opting for loans, with an average monthly payment of $413 in 2021.
The average age of car buyers by brand globally is around 12 years old.
- SUVs remain the most popular body style in both new and used car markets.
- Certified Pre-Owned (CPO) vehicles represent about 23% of used car sales at franchised dealerships.
Factors Affecting the Growth of the Used Car Industry
Several factors have driven the growth of the used car industry. Growing consumer inclination towards cost-effective mobility solutions is a key driver, driven by economic uncertainty and rising new car prices Urban consumers are opting for used cars previously received with increasing consideration of its affordability and practicality. In addition, technological advances in safety and connectivity make used cars more attractive. Sustainability concerns are driving demand, as consumers seek to reduce environmental impact by extending vehicle lifecycles. Websites facilitate communication and expand market access. Macroeconomic factors such as fuel prices and disposable income also influence industry growth, shaping the trajectory of the used car market

Global Used Car Market Trends
Due to factors such as affordability, technological advancements, and changing consumer preferences, the used car industry has become an integral part of the automotive industry This overview examines the major trends in the global automotive execute market, including market size, vendor types, regional trends, vehicle preferences, and sales channels Navigate It is important for stakeholders to do so.
Market Size & Trends
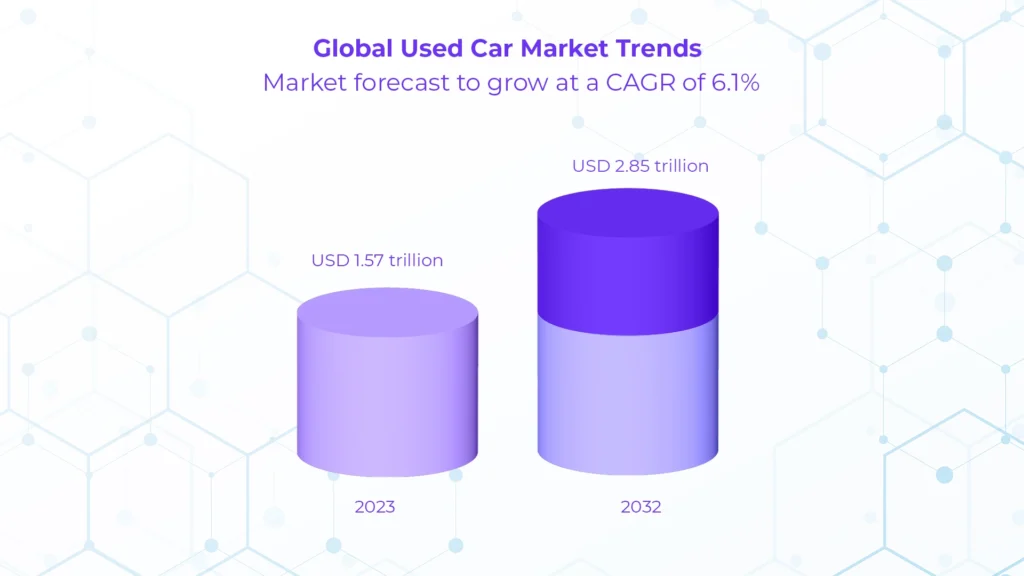
In 2023, experts valued the global used car market at USD 1.57 trillion and project it to reach around USD 2.85 trillion by 2032, growing at a compound annual growth rate (CAGR) of 6.80% over the forecast period from 2023 to 2032.
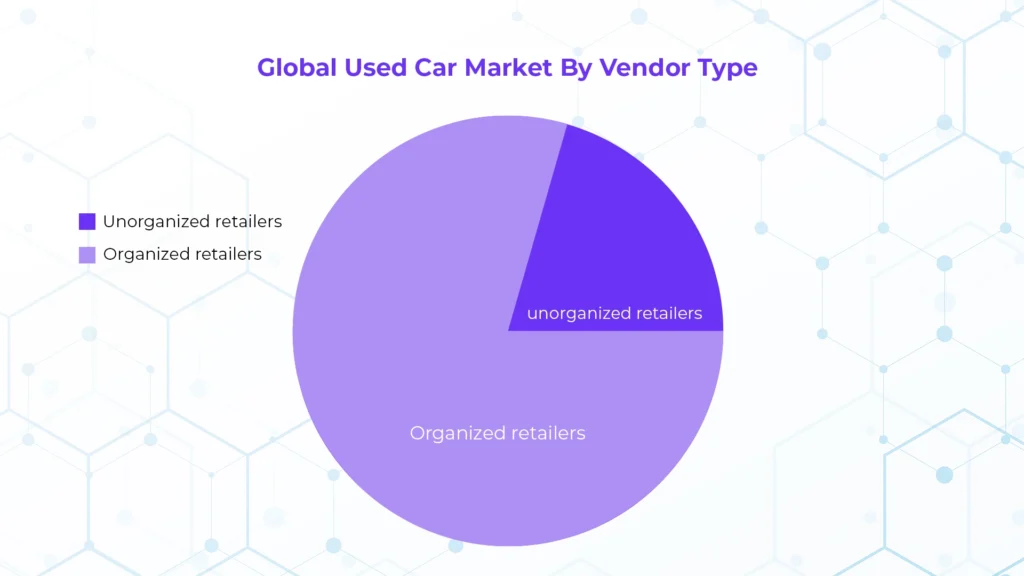
Vendor Type Search
Organized retailers, representing 74.3% of revenues, will grow at a CAGR of 7.1%, with franchised retailers or unorganized retailers leading the way.
Community Review
North America accounts for the largest revenue share at 35.7%, with vehicles leading the way and catering to different budgets
Vehicle Type Search
Conventional fuel cell vehicles hold the largest revenue share at 42.8%, while experts expect electric vehicles (EVs) to grow the fastest at a CAGR of 7.2%.
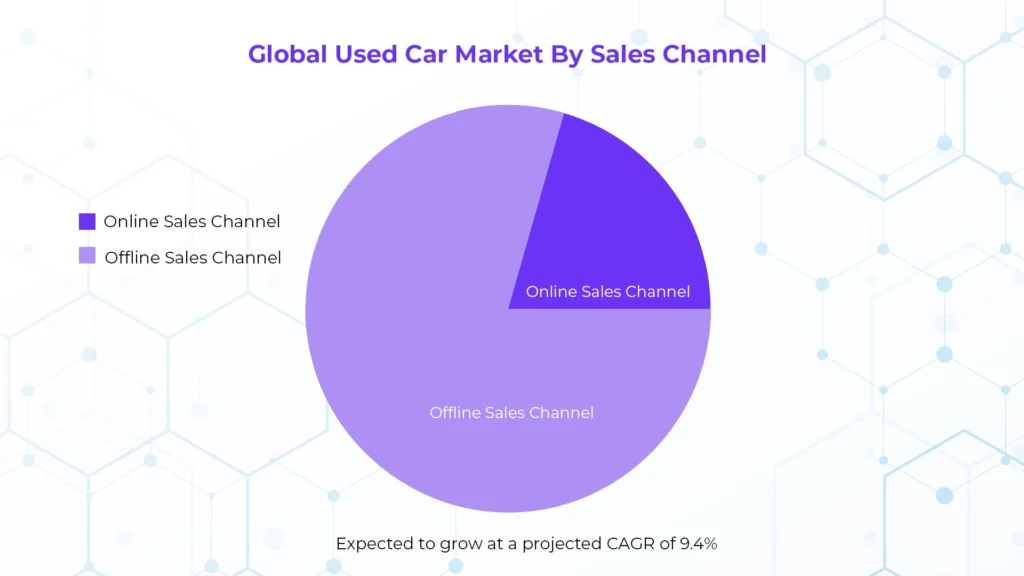
Store Insights
Currently, the offline sales channel holds a dominant market share of 74.8%, but experts expect online sales to grow significantly at a projected CAGR of 9.4%.
Used Car Market Report Segmentation
The used car market can be divided into a few main types to understand the various factors involved. Additionally, Here are some of the most common segmentation techniques used in reports.
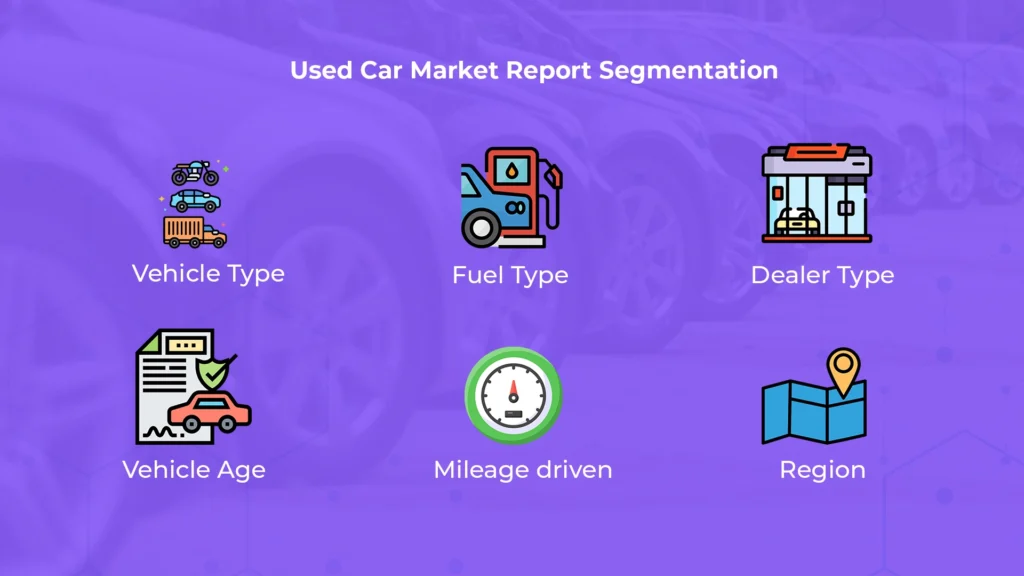
Vehicle Type
This segments the market based on vehicle type, such as hatchback, sedan, SUV, truck, van, etc. SUVs tend to be the most popular segment of the used car market because of their versatility and usefulness.
Fuel Type
This division looks at the type of fuel the vehicle uses, such as gasoline, diesel, electric, hybrid, etc. Fuel-type preferences may vary depending on fuel prices, government regulations, and such things as environmental problems.
Dealer Type
This section focuses on the used car dealer. They can be classified as an authorized dealer (especially car companies), an independent dealer, or an individual dealer. Due to factors such as trust and wide choice, franchised vendors tend to hold a larger market share
Vehicle Age
This breakdown looks at the age of a used car. Additionally, It can be helpful to understand which age groups are most in demand and how age can affect pricing.
Mileage driven
Like age, mileage distribution refers to the number of kilometers or miles driven. Lower mileage usually means the car is more expensive.
Region